Fed Days and Market Returns
Prior to each FOMC meeting and policy announcement, we send out a “Fed Days” report that focuses on the market’s expected and historical reaction to rate decisions. If you’re not currently a paid Bespoke research member, you can view this month’s Fed Days report published this past Tuesday here.
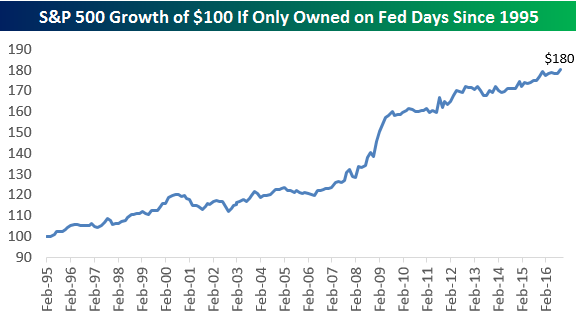
Since the end of 1994 when the Fed began announcing policy decisions on the day of its meetings, the S&P 500 has averaged a gain of roughly 0.34% on Fed Days. That may not seem like much, but it’s more than 10x the average change of 0.03% for all trading days since 1995. And the gains really add up over time. Below is a chart (from our Fed Days report) showing the growth of a $100 investment in the S&P 500 if you only held the index on Fed Days since 1995. As shown, your $100 would now be worth $180. That’s an impressive return considering that Fed Days only make up 3% of all trading days.
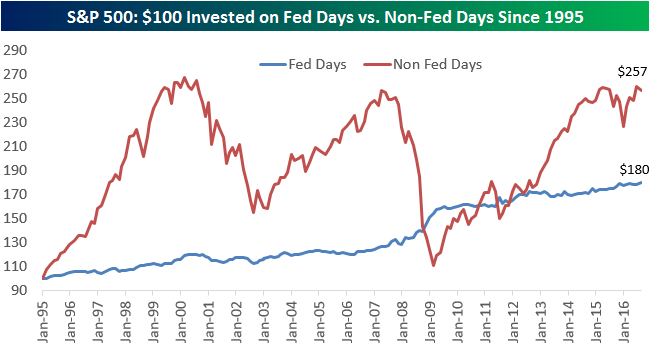
Below is a chart showing the growth of $100 invested in the S&P 500 on all days except for Fed Days since 1995. We also include the data from the chart above showing the growth of $100 invested in the S&P on just Fed Days over the same time period. As shown, $100 in the S&P on all days except for Fed Days leaves you with $257 today. That’s not bad, but it’s also not multiples higher than the $180 that only investing on Fed Days has yielded. Basically, while Fed Days have made up just 3% of all trading days since 1995, they’ve accounted for roughly 35% of the S&P 500’s gains. That’s a significant amount!
If you’d like to see more of Bespoke’s premium content, sign up for a no-obligation two-week free trial today!
ETF Trends: International – 9/23/16
The rally in everything over the last week continue to look stark, with just six ETFs in the universe of over 200 we track falling versus five days ago. Selling the USD has worked but being short anything else has been a grim experience for bears of both stocks and bonds. Commodities have led the rally, along with Latin American and Asian ETFs.

Bespoke provides Bespoke Premium and Bespoke Institutional members with a daily ETF Trends report that highlights proprietary trend and timing scores for more than 200 widely followed ETFs across all asset classes. If you’re an ETF investor, this daily report is perfect. Sign up below to access today’s ETF Trends report.
See Bespoke’s full daily ETF Trends report by starting a no-obligation free trial to our premium research. Click here to sign up with just your name and email address.
The Closer 9/22/16 – Tighter Labor Markets, Tighter Housing Markets
Looking for deeper insight on global markets and economics? In tonight’s Closer sent to Bespoke clients, we update a number of series signalling a tight labor market, break down the most recent existing home sales figures, analyze the Chicago Fed’s National Activity Index, and review Leading and Coincident Indicator data released today.

The Closer is one of our most popular reports, and you can sign up for a trial below to see it and everything else Bespoke publishes free for the next two weeks!
Click here to start your no-obligation free Bespoke research trial now!
Leading and Coincident Indicators Show No Signs of Recession
Bespoke’s Sector Snapshot — 9/22/16
We’ve just released our weekly Sector Snapshot report (see a sample here) for Bespoke Premium and Bespoke Institutional members. Please log-in here to view the report if you’re already a member. If you’re not yet a subscriber and would like to see the report, please start a 14-day trial to Bespoke Premium now.
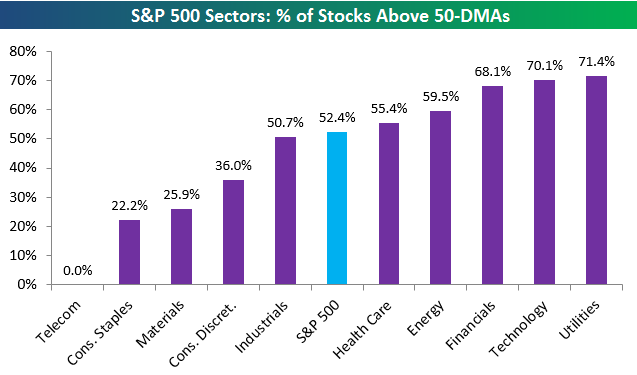
Below is one of the many charts included in this week’s Sector Snapshot, which shows the percentage of stocks in each sector that are trading above their 50-day moving averages. As shown, within the broad S&P 500, 52.4% of stocks are now above their 50-DMAs. Five sectors have readings above this level, and five have readings below this level. Utilities actually has the strongest breadth with 71.4% of stocks above their 50-days, but Technology is right on its heels at 70.1%. Telecom has the weakest reading with 0 stocks above their 50-days. It can’t get worse than that!
To see our full Sector Snapshot with additional commentary plus six pages of charts that include analysis of valuations, breadth, technicals, and relative strength, start a 14-day free trial to our Bespoke Premium package now. Here’s a breakdown of the products you’ll receive.
B.I.G. Tips – Years Like 2016: September Edition
Most Hated Stocks in the Russell 3,000
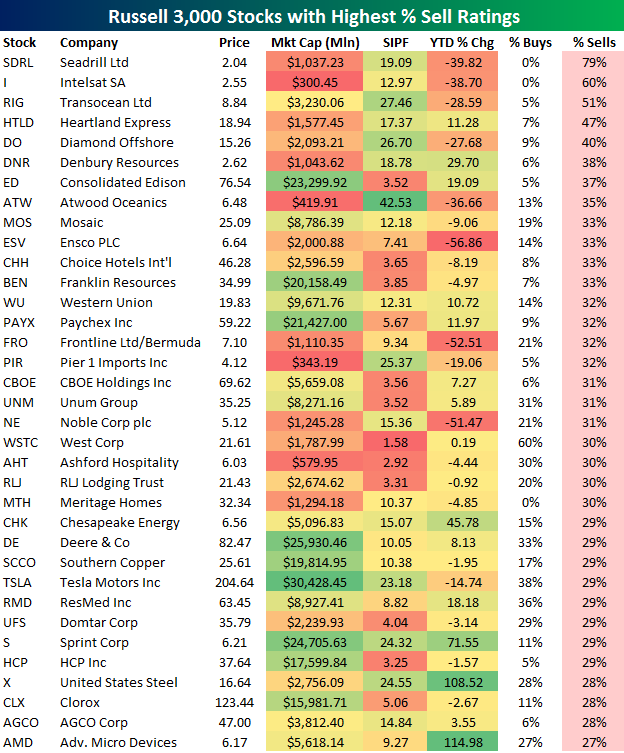
On Tuesday we highlighted a list of the Russell 3,000’s most heavily shorted stocks, and yesterday we highlighted a list of the index’s most loved stocks by analysts. Below is a table showing the most hated stocks by analysts in the Russell 3,000. To make the list, the stock has to have at least 10 analysts covering the stock. The 35 stocks below have at least 27% “Sell” ratings by analysts. For this analysis, ratings like “Underweight” or “Underperform” are considered “Sell” ratings as well.
Seadrill (SDRL) currently has the highest percentage of Sell ratings at 79%. Intelsat (I) ranks second at 60%, followed by Transocean (RIG) at 51% and Heartland Express (HTLD) at 47%. Other notables on the list of most hated stocks include Pier 1 (PIR), Chesapeake Energy (CHK), Deere (DE), Western Union (WU), Paychex (PAYX), Sprint (S), and US Steel (X). It should be noted that while a lot of these stocks are down big in 2016, there are quite a few that are up nicely as well. Advanced Micro (AMD) and US Steel (X) are actually both up more than 100%, which puts them near the very top of the Russell 3,000 in terms of YTD performance.
In the coming days we’ll continue to post similar tables showing the “best” and “worst” stocks based on various widely-followed characteristics.
ETF Trends: US Sectors & Groups – 9/21/16
What a difference a few days makes. Earlier this week, some of the 20 best performing ETFs were down versus five days before. Now, there are some ETFs trading higher than they were a week ago on the worst performers list! Iron ore has made a tentative short-term bottom in Asian trade over the last two days and that’s helped push up metals and mining as well as steel. Gold got a huge bid over the last two days following dovish reactions to the BoJ and FOMC. Biotech also continues to outperform. Despite a weakening USD post-FOMC, GBPUSD is still lower over the past five days and is the worst performer of ETFs we track. SEK has also been down notably, which is a bit confusing given the dollar index is also on the worst performers list.
Bespoke provides Bespoke Premium and Bespoke Institutional members with a daily ETF Trends report that highlights proprietary trend and timing scores for more than 200 widely followed ETFs across all asset classes. If you’re an ETF investor, this daily report is perfect. Sign up below to access today’s ETF Trends report.
See Bespoke’s full daily ETF Trends report by starting a no-obligation free trial to our premium research. Click here to sign up with just your name and email address.
the Bespoke 50 — 9/22/16
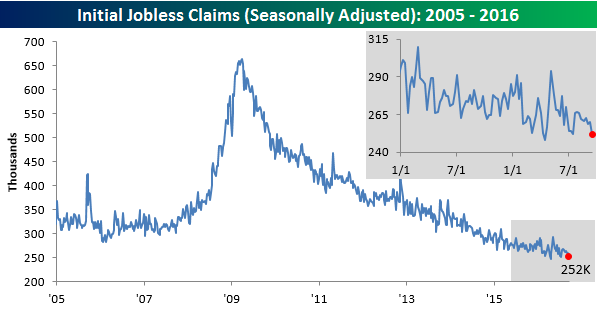
Jobless Claims Fall Further
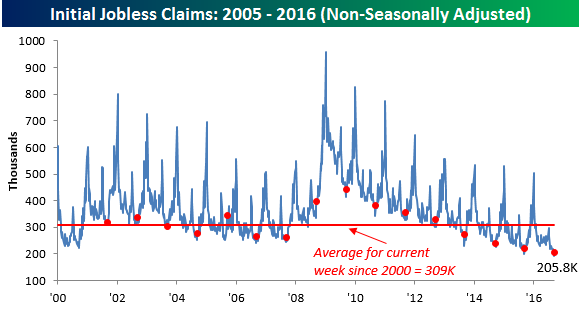
This week was the first time in eight weeks where economists’ consensus expectations for jobless claims was not 265K, and while they finally lowered their consensus forecast to 261K, the decline wasn’t enough as first time claims dropped to 252K, which was the lowest weekly reading since mid-July. At the risk of sounding like a broken record, this week’s report represents the 81st straight week that claims have been below 300K, which is the longest streak in over 40 years.
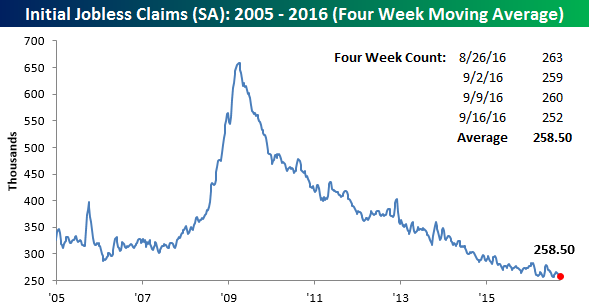
With this week’s decline, the four-week moving average dropped from 260.75K down to 258.5K. That’s the lowest level since late July and just 2.5K above the cycle low of 256K from April. We had a hard time believing that we would ever get back down near the cycle lows, but another week like this week’s print and the four-week moving average will be right there.
On a non-seasonally adjusted basis (NSA), jobless claims rose from 193.3K up to 205.8K. Despite the increase, this week’s reading is more than 100K below the average for the current week of the year since 2000 and the lowest reading since 1973. Judging by the standards of jobless claims at least, the labor market remains in pretty good shape.