The Closer 10/5/16 – Where’d All The Crude Go?
Looking for deeper insight on global markets and economics? In tonight’s Closer sent to Bespoke clients, we take a look at where the 26 million barrels that have flowed out of US storage facilities over the last week have gone. We also discuss today’s Factory Orders report.

The Closer is one of our most popular reports, and you can sign up for a trial below to see it and everything else Bespoke publishes free for the next two weeks!
Click here to start your no-obligation free Bespoke research trial now!
Chart of the Day: Under-Appreciated Airline
Salesforce.com (CRM) vs. Twitter (TWTR) Market Cap
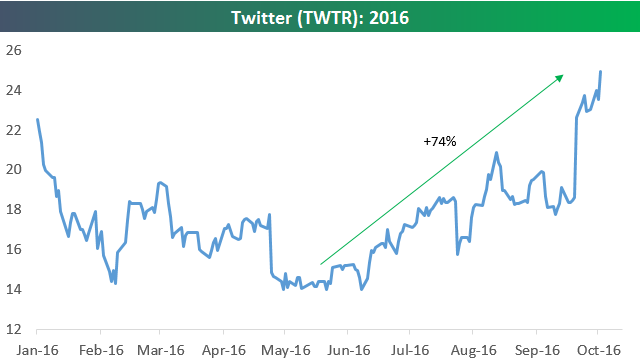
Back on May 26th, salesforce.com (CRM) hit its highest price level of the year. Since then, the stock is down 19%. Roughly around the same time that CRM peaked, shares of Twitter (TWTR) were hitting all-time lows in the high $13s. Since those lows, TWTR shares are up 75%.

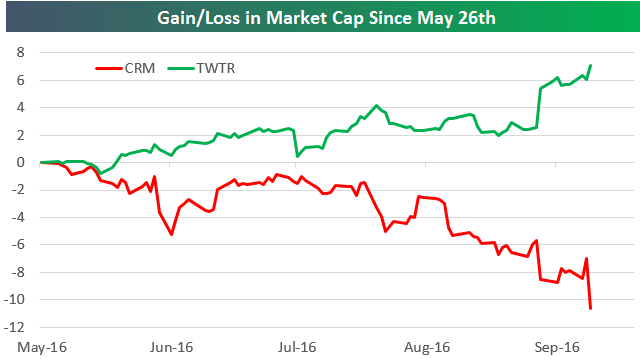
Back in late May at its highs, CRM had a market cap of just over $56 billion. At that time, TWTR’s market cap was just under $10 billion. The chart below shows the change in market cap for each company since May 26th. As shown, CRM has lost more than $10 billion in market cap, while TWTR has gained more than $7 billion in market cap.
Most of TWTR’s market cap gains recently are due to buyout rumors that have really heated up over the last few days, while investors have crushed CRM for simply being in the mix on a TWTR buyout. When investors sell a stock that hard on just the thought of a buyout, it says a lot about what they think of it. Had CRM done the buyout back in May, though, they could have likely gotten a much better deal. At CRM’s highs, Twitter’s market cap was 18% of CRM’s market cap. As of this afternoon, TWTR’s market cap is 38% of CRM’s market cap.
Remember, LinkedIn (LNKD) was another name rumored to be on CRM’s radar earlier this year, but Microsoft swooped in and bought LNKD back in June. After missing out on LNKD, investors think CRM would be reaching if they bought TWTR. At this point, though, with CRM down so much, how much more downside is there even if Benioff and company do go for TWTR? And if they don’t reach a deal with TWTR, how much will the stock rally?
Fixed Income Weekly – 10/5/16
Searching for ways to better understand the fixed income space or looking for actionable ideals in this asset class? Bespoke’s Fixed Income Weekly provides an update on rates and credit every Wednesday. We start off with a fresh piece of analysis driven by what’s in the headlines or driving the market in a given week. We then provide charts of how US Treasury futures and rates are trading, before moving on to a summary of recent fixed income ETF performance, short-term interest rates including money market funds, and a trade idea. We summarize changes and recent developments for a variety of yield curves (UST, bund, Eurodollar, US breakeven inflation and Bespoke’s Global Yield Curve) before finishing with a review of recent UST yield curve changes, spread changes for major credit products and international bonds, and 1 year return profiles for a cross section of the fixed income world.
This week, we talk about selecting efficient hedges for a dramatic uptick in interest rates.
Our Fixed Income Weekly helps investors stay on top of fixed income markets and gain new perspective on the developments in interest rates. You can sign up for a Bespoke research trial below to see this week’s report and everything else Bespoke publishes free for the next two weeks!
Click here to start your no-obligation free Bespoke research trial now!
Crude Oil Inventories Continue to Plunge
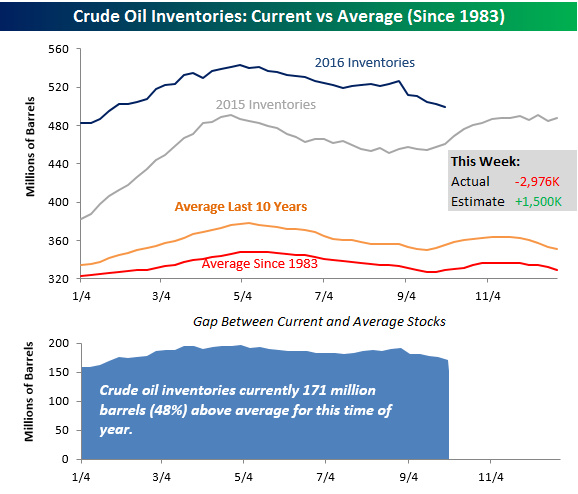
Crude oil inventories for the latest week were released earlier today, and for the fifth straight week showed an unexpected decline. Now, we often comment about economists’ consensus forecasts for various indicators and how they often vary widely from the actual reported number, but the recent track record of traders predicting the weekly inventory print from the DoE is a joke. In this week’s report, consensus expectations were for stockpiles to increase by 1.5 million barrels, but the actual change was a decline of 2.976 million barrels.
As shown in the chart below, crude oil inventories have continued to decline in recent weeks even as we are now in a seasonal period where inventories have started to rise. Even with the recent declines, though, crude oil stockpiles are still above levels they were at this time last year and much higher than the average levels of the last ten years or going all the way back to 1984. To illustrate, at current levels crude oil stockpiles are 171 million barrels (48%) above average for this time of year. So, there’s still that, but if you are bullish on crude oil prices, things are moving in the right direction of late.
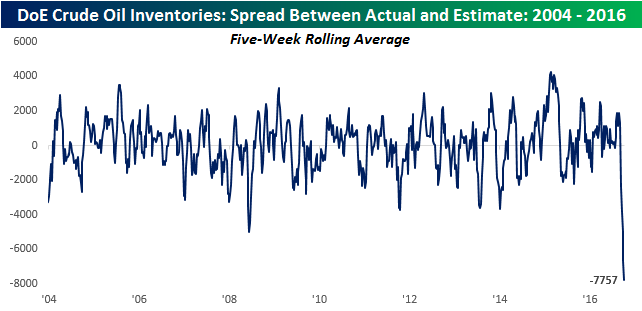
Getting back to the dismal record of traders predicting the weekly change in crude oil stockpiles, the chart below shows the rolling 5-week spread between the actual reported change in inventory levels and the consensus forecast. At an average spread of more than 7.7 million barrels, traders have overestimated the weekly change in inventories over the last five weeks by the widest margin since at least 2003.
Bespoke’s Q4 Outlook: A Closer Look at Earnings Season Sentiment
On Friday, September 30th, we held our Q4 Outlook call for clients. This is the third quarter in a row we’ve held an outlook call, which has proven to be a very popular feature among Bespoke clients. The quarterly outlooks are an outgrowth of Bespoke’s widely read and quoted annual outlook piece, The Bespoke Report, which is released at the end of December each year. A recording of Friday’s call and the 26-page presentation are available with any paid membership to Bespoke. Review our subscription options and choose any plan to listen to the call and view the presentation.
One of the most popular elements of the outlook (this quarter and in the past) is our view of analyst sentiment heading into earnings season. We never mean to kick the analyst community, but historically speaking, sentiment among analysts has been a great contrarian indicator for stock performance. As has been the case for quite some time, analysts are once again lowering forecasts heading into this earnings season, which officially kicks off on 10/10 with Alcoa (though the bulk of earnings reports won’t come out til later in the month). As you can see in the preview of the slide below, there are a few notable points about this upcoming earnings season:
- Technology and Utilities are the only two sectors with a positive “earnings revision spread,” which means the bar may be set too high for those sectors (remember, earnings revision spread is a contrarian indicator in our view).
- While analysts are negative, management teams are actually much more positive: “warnings” from companies about results are at relatively low levels for this time of year.
- In the last 23 quarters in which the revisions spread was negative, the S&P 500 traded higher 18 times.
As mentioned earlier, the outlook presentations (including recording of the calls) are available with ALL of our membership levels. Review our subscription options and choose any plan to access our Q4 Outlook along with the rest of Bespoke’s daily research.

B.I.G. Tips – A Nearly Flawless ISM Services Report
ETF Trends: Hedge – 10/5/16
Precious metals and rates-related ETFs continue to get absolutely smacked as global yields have risen over the last few days. Gold miners have had one of their worst two-day streaks in history over the last two days and are off an eye-watering 15% in the last five trading days. For oil, continued strong inventory draws are supporting prices today. Higher rates have benefited banks, which are outperforming on both sides of the Atlantic, while the solid run for semiconductors also continues.

Bespoke provides Bespoke Premium and Bespoke Institutional members with a daily ETF Trends report that highlights proprietary trend and timing scores for more than 200 widely followed ETFs across all asset classes. If you’re an ETF investor, this daily report is perfect. Sign up below to access today’s ETF Trends report.
See Bespoke’s full daily ETF Trends report by starting a no-obligation free trial to our premium research. Click here to sign up with just your name and email address.
Bespoke Consumer Pulse Report: September 2016
Bespoke’s Consumer Pulse Report is an analysis of a huge consumer survey that we run each month. Our goal with this survey is to track trends across the economic and financial landscape in the US. Using the results from our proprietary monthly survey, we dissect and analyze all of the data and publish the Consumer Pulse Report, which we sell access to on a subscription basis. Sign up for a 30-day free trial to our Bespoke Consumer Pulse subscription service here.

Crude Oil and Equity Prices
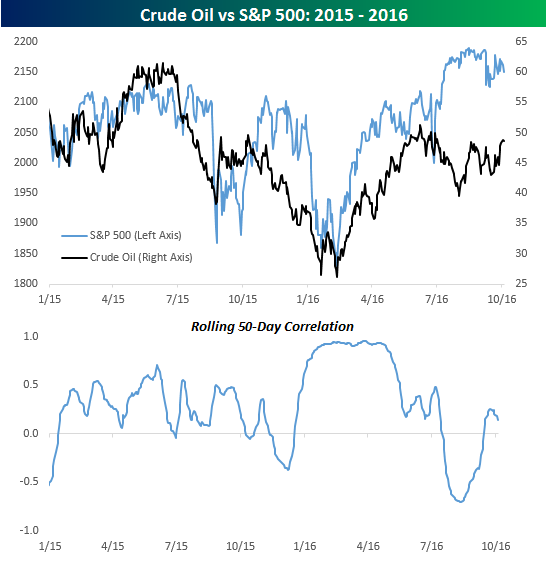
Crude oil prices are up 2% this morning and pushing $50 after the weekly inventory report from API showed a larger than expected drawdown in stockpiles. Earlier this year, a 2% rally in crude oil prices would have been enough to put a strong bid in S&P 500 futures, but this time around equity prices saw no reaction to the uptick in crude prices. While equities are higher in early trading, the move in futures didn’t come until after the release of the September ADP report well after last night’s crude report.
In the last several weeks, crude oil and equity prices have become increasingly uncorrelated. This divergence can be seen in the charts below. There was a time earlier this year when crude oil and equity prices moved in lockstep with each other. In fact, from 1/25 through 4/26, the rolling 50-day correlation between the closing prices of crude and the S&P 500 was above 0.90 for 64 out of 65 trading days (two streaks of 32 straight days). To put this in perspective, going back to 1990, there have only been two other periods where the rolling 50-day correlation was above 0.90 for more than thirty trading days (December 2008 and October 2011), but this year we have already seen two separate streaks!
For the last few months, though, equities have managed to rally and make new highs even as the rally in crude oil consolidated. To us, the fact that equities have rallied even as crude has stalled is a signal that crude oil’s level is more important than its direction. As long as the price can maintain a floor of $40 and barring a spike induced by a geo-political event, the short-term moves in crude oil should continue to have much less of an impact on the direction of equity prices.