B.I.G. Tips – Earnings Season Preview and Analyst Sentiment
With the third quarter ending last week, Q3 earnings season is right around the corner. For investors, there is some optimism that the current quarter will show better overall growth than we have recently seen. We have always considered earnings season to be the period covering earnings reports starting with Alcoa (AA) and ending with Wal-Mart (WMT). Although AA is far from the industrial powerhouse that it used to be and is in the process of splitting up, most companies report in this window, so we use these two companies as our rough start and end dates for the coming earnings season.
The real heart of earnings season doesn’t begin for a couple more weeks, and the peak reporting day for this earnings season is not until 10/27 when more than 60 companies in the S&P 500 will report. Outside of AA on 10/11, the only other real major reports next week are CSX on 10/12, Wynn Resorts (WYNN) on Thursday, and then several banks including Citigroup (C), JP Morgan (JPM), PNC, and Wells Fargo (WFC) on Friday. For a more detailed rundown of the earnings schedule for the upcoming season, please see our Interactive Earnings Calendar.
As we do each quarter, we just posted our quarterly preview of the coming earnings season based on trends in analyst revisions for the market as a whole and individual sectors. For anyone who trades in the market on a regular basis, this report is a must read. To view it, sign up for a monthly Bespoke Premium membership and get 10% off for life ($89/month).
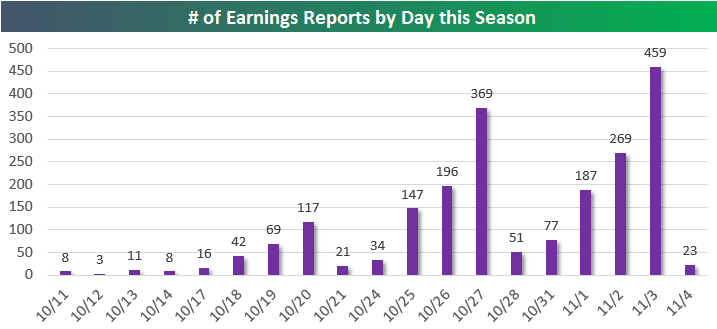
Chart of the Day: Earnings Season Cometh
Bespoke’s List of the “Most Volatile Stocks on Earnings”
The third quarter earnings reporting period begins next Tuesday when Alcoa (AA) kicks things off. But as shown in the chart below, things don’t really pick up until later this month. Next week just 30 companies will report earnings, while 797 companies will report in the last week of October. The first week of November is even busier with more than 1,000 companies set to report.
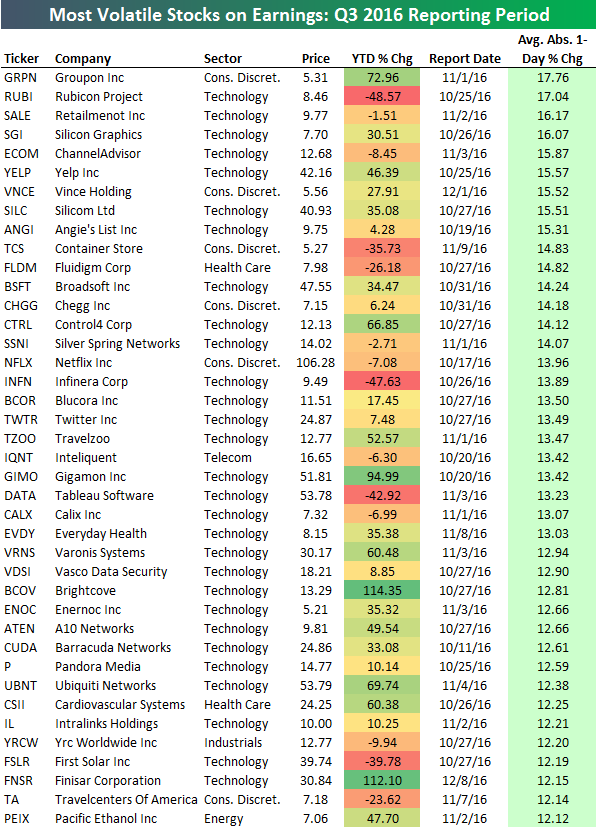
At the start of each earnings season, Bespoke always publishes its list of the “most volatile stocks on earnings.” This list is built using our Interactive Earnings Database which contains more than 120,000 quarterly earnings reports for more than 4,000 stocks going back to the turn of the millennium.
Below are the 40 stocks set to report earnings over the next two months that have historically experienced the biggest moves on their earnings reaction days. For stocks that report in the morning before the open, that trading day is its “earnings reaction day.” For stocks that report after the close, the next trading day is its “earnings reaction day.” To make the list, a stock must have at least 10 quarters of earnings reports and trade above $5/share.
As shown, Groupon (GRPN) is the single most volatile stock on earnings with an average one-day change of +/-17.76%. That means GRPN shareholders can typically expect a one-day reaction of nearly 20% when the company reports every three months! Buckle up when GRPN reports on November 1st. The second most volatile stock on earnings is Rubicon Project (RUBI) with an average move of +/-17.04%, followed by Retailmenot (SALE) at +/-16.17%, Silicon Graphics (SGI) at +/-16.07%, and ChannelAdvisor (ECOM) at +/-15.87%. Other notables on the list include Yelp (YELP), Twitter (TWTR), Tableau Software (DATA), Pandora (P), and First Solar (FSLR).
If you’re looking for action this season, be sure to follow these stocks! If you’re new to Bespoke or you’ve simply never looked into our research subscriptions, earnings season is a great time to try us out. Click here to start a 14-day no-obligation free trial.
ETF Trends: US Sectors & Groups – 10/6/16
Oil continued to rally and gold continued to fall since our update yesterday. As shown below, USO and DBO are the two best performing ETFs from the 200+ we track over the last five days. Gold miners, silver, and precious metals generally have been the opposite side of the coin, absolutely crushed as gold tests its 200-DMA. Utilities, long-term bonds, mortgages, and other carry proxies have gotten absolutely demolished over the past week as well.

Bespoke provides Bespoke Premium and Bespoke Institutional members with a daily ETF Trends report that highlights proprietary trend and timing scores for more than 200 widely followed ETFs across all asset classes. If you’re an ETF investor, this daily report is perfect. Sign up below to access today’s ETF Trends report.
See Bespoke’s full daily ETF Trends report by starting a no-obligation free trial to our premium research. Click here to sign up with just your name and email address.
September Jobs Report Preview
 Tomorrow morning’s release of the September Non Farm Payrolls report will go a long way in determining when (and if) the FOMC will ultimately bite the bullet and hike rates again. As it stands now, economists are currently expecting an increase in payrolls of 172K, which would be a 21K increase from last month’s weaker than expected reading of 151K. In the private sector, economists are expecting an increase of 170K, which would be an even larger improvement than the increase in the overall headline reading. The unemployment rate is forecasted to remain at 4.9%. Growth in average hourly earnings is expected to accelerate back up to 0.3%, while hours worked is forecast to increase to 34.4 from 34.3. August’s employment report was a negative surprise for the market and kicked off what was essentially a steady stream of weaker than expected August data. Data for September has so far shown signs of a rebound, so we’d look for some strength in Friday’s report as well.
With such high stakes surrounding the report, the market will likely have a big reaction to the upside or downside based on how the number comes in relative to expectations. To that end, last night we published our eleven-page monthly preview for the September jobs report. This report contains a ton of analysis related to how the equity market has historically reacted to the monthly jobs report, as well as how secondary employment-related indicators we track looked in September. We also include a breakdown of how the initial reading for September typically comes in relative to expectations and how that ranks versus other months.
For anyone with more than a passing interest in how equities are impacted by economic data, this report is a must read. To see the report, sign up for a monthly Bespoke Premium membership and get 10% off for life ($89/month).
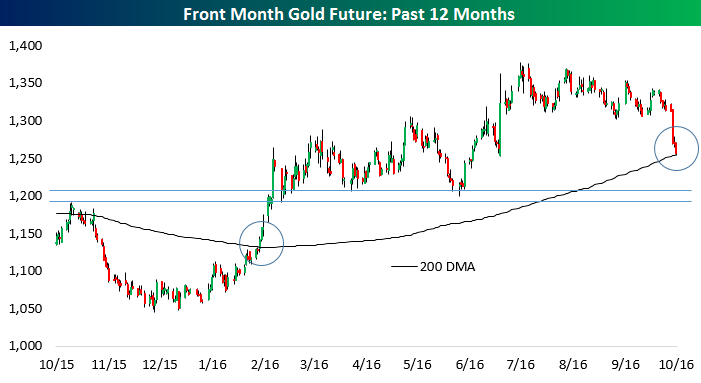
Gold Reaches Its 200 Day Moving Average
As shown in the chart below, front-month gold futures are testing their 200-day moving average today. The 200-DMA is a widely-watched technical level, and earlier this year a move above that level for gold was a signal for the strong gains posted in February. After that rally, gold tested $1200 in late May before rocketing higher once again in the wake of the Brexit vote. But over the last three days the yellow metal has broken down significantly. Since Monday’s close, gold is off 4.3% and the 200-DMA is now in play. Below that, it’s another 4.5% decline to the pivot zone around $1200 that has served as a big signal over the past year. For bulls, there’s hope the 200-DMA holds. For the bears, a move below that level ($1255) will target another $55 decline.
Jobless Claims Continue Strong Showing
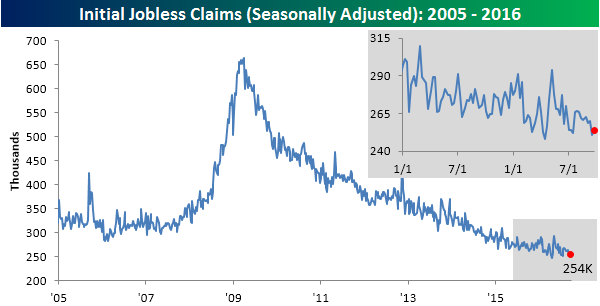
Jobless claims are back below 250,000. This week’s print of 249,000 is 1,000 above the cycle low of 248,000 printed in April, but the overall trend of extremely low claims has broadly persisted since that low. Despite occasional upticks, seasonally-adjusted claims have stuck near the lowest levels of the modern era. When claims were last this low, in the 1970s, the population and labor force were both dramatically smaller; it’s fair to call the current claims situation the strongest on record.
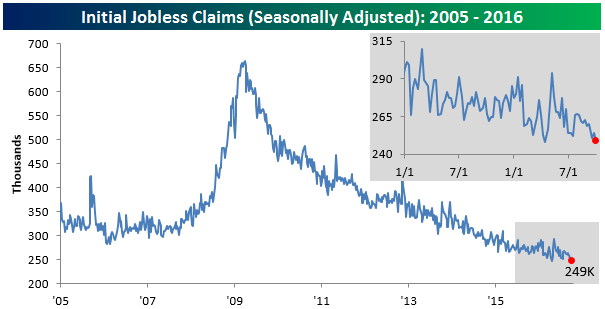
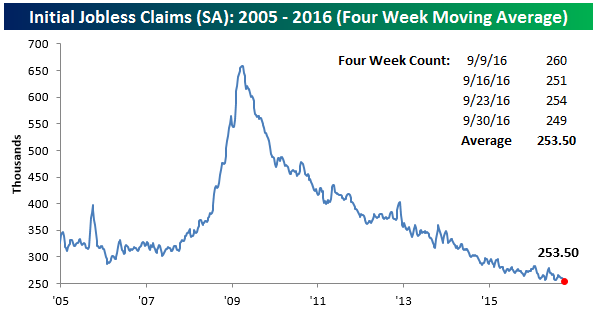
Unlike the current week claims figure, the four week average of initial claims did make a new low for the cycle. It’s much stronger than prior cycle lows from recent history, illustrating the persistent lack of layoffs from employers across the economy. New lows in this moving average are a good sign that the current economic expansion is continuing forward.
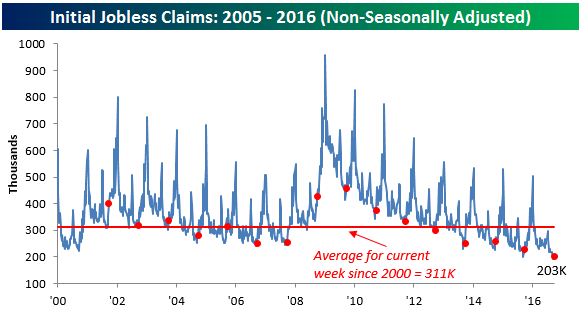
Relative to the average since 2000, non-seasonally adjusted claims are almost one-third below the average level they’ve made for this week of the year since 2000. They also made a new low for this week of the year relative to recent periods, confirming the strength displayed by seasonally adjusted claims.
Also notable in their strength were the continuing claims figures. They’re now knocking on the door of 2mm, having surged well above 6mm at the height of the crisis. Since August 5th, 117,000 workers have moved off of unemployment claims rolls. It’s important to note that these departures could have been workers finding jobs, or workers losing eligibility for benefits. Either way, the lack of new entrants to continuing claims rolls has failed to keep their numbers up; that’s a good sign for the labor market ahead of Friday’s September Employment Situation Report, including the nonfarm payrolls number.
Bespoke CNBC Appearance (10/6)
Bespoke’s Paul Hickey appeared on CNBC’s Squawk Box on Thursday morning to discuss jobs, the economy, and markets. To view the segment, please click on the image below.

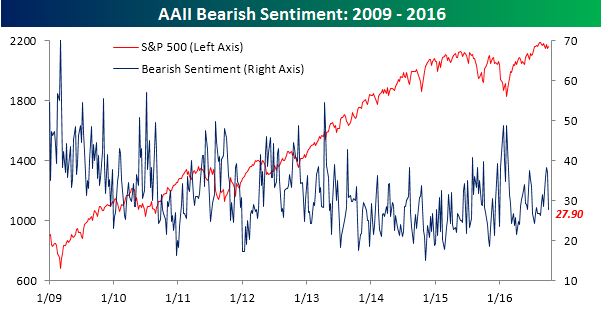
Bullish Sentiment Rises to Below Average Levels
The latest sentiment figures from AAII were released earlier this morning and showed a pretty healthy increase in bullish sentiment. After dropping down to 24% last week, bullish sentiment increased 4.79 percentage points to 28.79%. That was the largest weekly increase since July, but even with that jump, optimism still remains well below levels that would be considered average. In other words, after the largest weekly increase in nearly three months, bullish sentiment rose to below average levels! This week’s reading is the 49th straight week that bullish sentiment has been below 40% and the 84th week in the last 85. There are still twelve weeks left in 2016, but at the rate things are going, 2016 is on pace to be the first year in the history of the AAII survey that bullish sentiment never went above 40%.

While bullish sentiment increased by just under 5 percentage points, bearish sentiment plummeted by over nine percentage points, falling from 37.11% down to 27.9%. That was the largest one-week decline since mid-February, but as shown in the chart, the trend of higher lows for bearish sentiment remains in place.