ETF Trends: US Indices & Styles – 10/11/16
Natural gas continues to impress as inventories draw out and exports of US production ramp up slowly. Commodities have also outperformed despite the surge in the USD over the last few days; it’s currently trading at multi-month highs and is poised on a breakout. That hasn’t hurt many EM names; Brazil and Mexico have done well over the last few days. Steepening yield curves in the US have also helped banks. On the worst performers list, New Zealand has continued to plunge after dramatically outperforming global stocks for the last couple of years. Brexit-bashed GBP has also plunged.

Bespoke provides Bespoke Premium and Bespoke Institutional members with a daily ETF Trends report that highlights proprietary trend and timing scores for more than 200 widely followed ETFs across all asset classes. If you’re an ETF investor, this daily report is perfect. Sign up below to access today’s ETF Trends report.
See Bespoke’s full daily ETF Trends report by starting a no-obligation free trial to our premium research. Click here to sign up with just your name and email address.
Bespoke Stock Scores: 10/11/16
Historical Earnings and Revenue Beat Rates
Earnings season has now begun with Alcoa’s (AA) report this morning before the open. With AA down 10% on the day, things aren’t getting started on a great note.
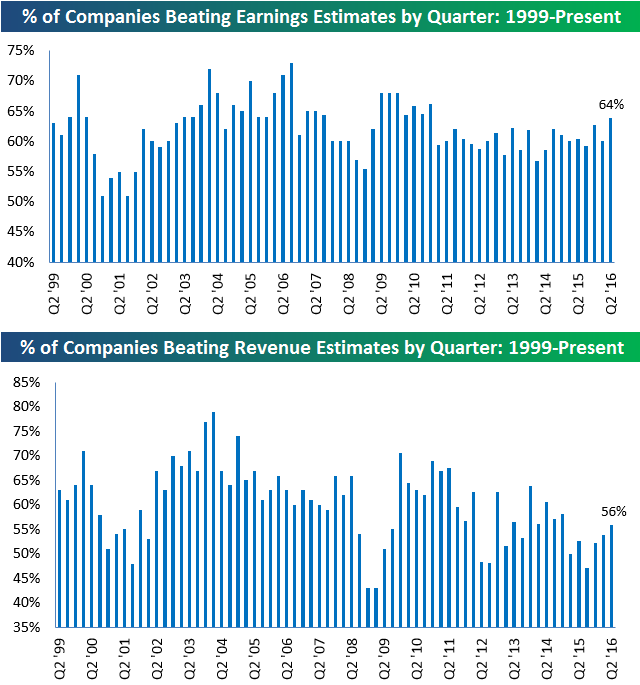
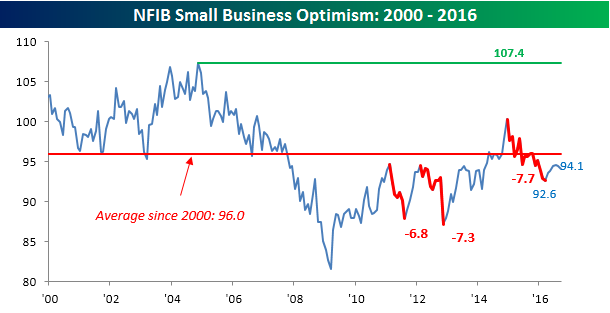
Now that earnings season has started, what do expectations look like? Below is a look at the historical “beat rates” for bottom-line EPS and top-line revenues for every quarterly earnings season going back to 1999. Over this period of 17 years, the average quarterly earnings beat rate (% of companies beating their consensus analyst EPS estimate) has been 62%. The average revenue beat rate has been slightly lower at 60%.
As shown in the first chart below, earnings beat rates were much higher during the bull market of the mid-2000s, and a lower bar has been set over the last five years. Last quarter, though, we saw the highest earnings beat rate since Q4 2010 at 64%. Can we beat that this quarter?
As shown in the second chart, revenue beat rates have steadily trended lower over the years, but notably, we’ve seen a quarter-over-quarter increase in top-line beat rates over the last three earnings seasons. Last season, the revenue beat rate came in at 56%, and investors will want to see another quarter-over-quarter increase this season.
If you’re new to Bespoke or you’ve simply never looked into our research subscriptions, earnings season is a great time to try us out. Click here to start a 14-day no-obligation free trial. We’ll be updating the charts below and many other earnings-related data points all month long.
Small Business Sentiment Comes Up Short
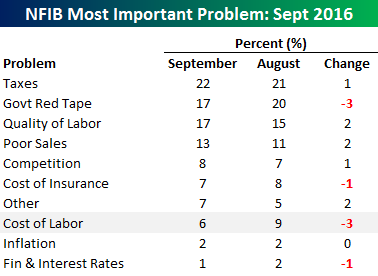
Although a number of economic data-points showed a rebound in September, the latest release of small business sentiment from the NFIB showed further weakness. While economists were forecasting the headline index to come in at 95.0, the actual reading was 94.1, which was down modestly from 94.4. With this month’s decline, the headline reading is not only still well below its average of 96.0 since 2000, but also just 1.5 above its recent low of 92.6. Based on the commentary in this month’s report, when it comes to politics, small business owners are not optimistic. As noted in the report, “The presidential election is so divisive that it offers little promise of a bipartisan effort to deal with any of these important issues once a new management team is installed in Washington D.C. Fiscal policy, badly in need of an overhaul, will face similar challenges. The political impasse leaves owners with the prospect of slow growth, more uncertainty and little capital spending beyond ‘maintenance’.”
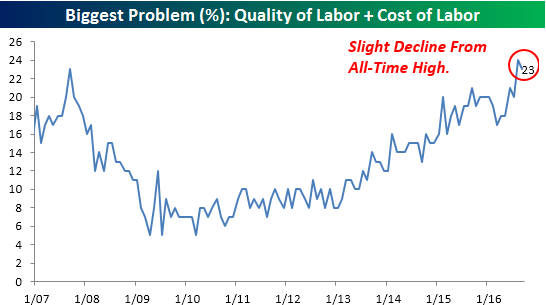
 When it comes to the largest problems being faced by small business owners this month, there were some interesting shifts. The table to the right shows the percentage of small businesses citing various issues as their “number one problem.” As is nearly always the case, “Taxes” tops the list at 22%, which is up from 21% in August. Right behind the taxman and tied for second place is “Government Regulations/Red Tape,” but at 17%, this issue saw a sizable decline from 20% in August. That now puts it at the same level as “Quality of Labor,” which increased two percentage points up to 17% from 15% in August.
The percentage of companies citing labor quality as their biggest problem is now at its highest level since at least 2008, and it comes on the heels of last month’s survey where a record 9% of small business owners cited “Cost of Labor” as their number one problem! In the case of costs this month, the percentage of business owners citing it declined, but these two moves suggest that when it comes to labor, small business owners are having issues. If you aren’t willing to pay up for labor, quality is likely to suffer, but if you do pay up, costs increasingly become an issue. The chart below shows the combined percentage of small business owners citing Quality or Costs related to labor as their number one problem each month. At 23%, this reading is just off a ten-year high of 24% hit last month.
Dynamic Upgrades/Downgrades: 10/11/16
The Closer 10/10/16 – USDMXN Hedges, Transportation Activity
Looking for deeper insight on global markets and economics? In tonight’s Closer sent to Bespoke clients, we take a look at hedges which are correlated to USDMXN, the asset which has felt the most impact from the Presidential election in the US. We also take a look at unofficial readings of transport index activity.

The Closer is one of our most popular reports, and you can sign up for a trial below to see it and everything else Bespoke publishes free for the next two weeks!
Click here to start your no-obligation free Bespoke research trial now!
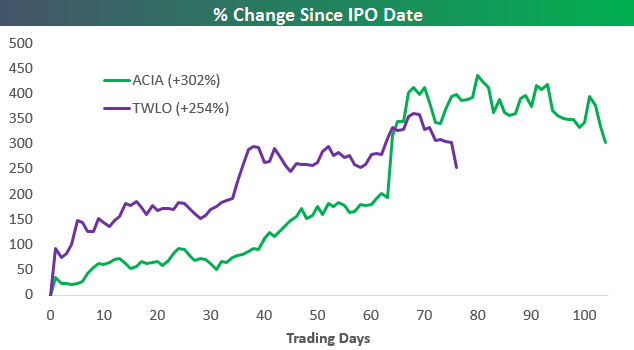
IPO Darlings Acacia (ACIA) and Twilio (TWLO) Experience Gravity
Back on August 22nd, we wrote an article titled “Can the Fun Last for ACIA and TWLO?” that looked at the stellar performance experienced by the two stocks since they IPOd earlier this year. In the article, we compared the runs experienced by ACIA and TWLO in the first few months of their lives as a public company to the runs that both Shake Shack (SHAK) and GoPro (GPRO) experienced as well. At that point, Acacia (ACIA) was up 404% since its IPO three months earlier, while Twilio (TWLO) was up 268% since its IPO just two months earlier.
As shown below, both stocks have finally begun to cool off, and today they both saw steep drops. ACIA was down 7%, while TWLO was down 14%. At this point, ACIA is up 302% since its IPO and TWLO is up 254%.
In our prior article, we showed the chart below comparing the performance since their IPO dates for ACIA, TWLO, GPRO, and SHAK. For GPRO and SHAK, they both experienced huge runs in their first 75-80 trading days as a public company, but from there it was all downhill. ACIA has now been public for more than 100 trading days, while TWLO is at 76 trading days. While we don’t want to suggest that these two high-fliers are destined for future declines similar to GPRO and SHAK, we do think the chart offers up a good warning sign.
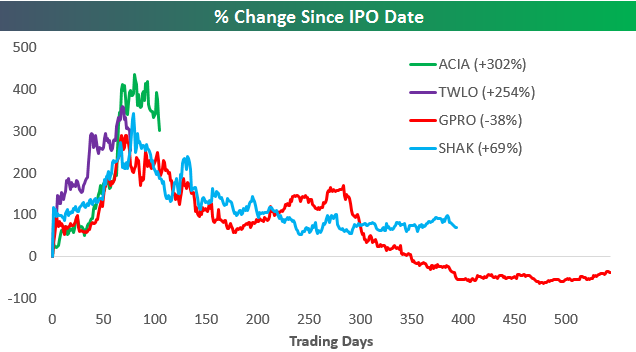
Chart of the Day: Do We Hear $60?
Bespoke Stock Seasonality Report: 10/10/16
ETF Trends: Fixed Income, Currencies, and Commodities – 10/10/16
Energy remains the best in breed with oil and natural gas related ETFs topping the best performers list over the last week. Mexican pesos have surged in value, helping boost equities in that country from the perspective of the US investor, while a number of other international ETFs have also done quite well. Gold miners remains near the bottom of the performance list, down double-digits, while long-term bonds, REITs, and other yield plays continue to underperform. Despite buoyant local equity returns, UK stocks are also underperforming on a brutal week for pound sterling.
Bespoke provides Bespoke Premium and Bespoke Institutional members with a daily ETF Trends report that highlights proprietary trend and timing scores for more than 200 widely followed ETFs across all asset classes. If you’re an ETF investor, this daily report is perfect. Sign up below to access today’s ETF Trends report.
See Bespoke’s full daily ETF Trends report by starting a no-obligation free trial to our premium research. Click here to sign up with just your name and email address.