Bulls Under 40 for a Year and Counting
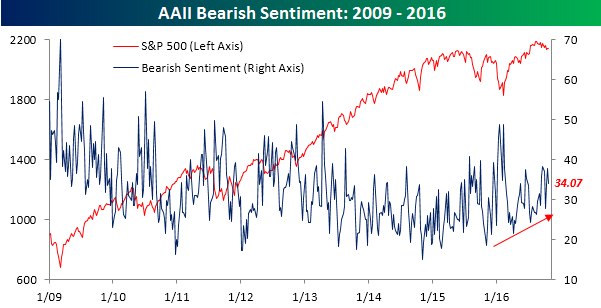
The streak of rotten investor sentiment on the part of individual investors continued this week. According to the weekly survey from AAII, bullish sentiment increased from 23.74% up to 24.75%, so while sentiment improved, more than three-quarters of individual investors do NOT consider themselves to be bullish. This week’s sentiment report also marked another milestone as bullish sentiment was below 40% for the 52nd straight week and the 86th week in the last 87. Or to put another way, since March 2015, bullish sentiment has only been above 40% once.

As bullish sentiment increased slightly, bearish sentiment declined, falling from 37.82% down to 34.07%. At this level, though, bears still comfortably outnumber bulls, which has been the case in eight of the last ten weeks. Like what you see? Sign up for a free trial to Bespoke’s paid research and receive access to everything we have to offer. No credit card is required.
The Closer 10/26/16 – Inventories: Crude & Homes
Looking for deeper insight on global markets and economics? In tonight’s Closer sent to Bespoke clients, we recap the weekly petroleum market report from the EIA, September New Home Sales, and very strong trade deficit data from today with GDP tracking implications.

The Closer is one of our most popular reports, and you can sign up for a trial below to see it and everything else Bespoke publishes free for the next two weeks!
Click here to start your no-obligation free Bespoke research trial now!
Chart of the Day: 10/26/16 – Largest Equity Mutual Fund Outflow in Over Five Years
Bespokecast Now Available on iTunes, GooglePlay, Overcast, and More
Last Friday we unveiled our new podcast series — Bespokecast — to Bespoke subscribers. In our first episode, we interviewed hedge fund veteran Mark Dow, who also has a large Twitter following @mark_dow and runs the Behavioral Macro blog.
Each new episode of our podcast will feature a special guest to talk markets with, and Bespoke subscribers receive access one week before it’s made available to the general public. If you’d like to try out a Bespoke subscription in order to gain access to these podcasts a week in advance, you can start a two-week free trial to check out our product. To listen to episode 1 or subscribe to the podcast via iTunes, GooglePlay, OvercastFM, or Stitcher, please click below.
ETF Trends: Hedge – 10/26/16
It’s a bit of a mixed bag in terms of recent ETF performance with coffee the biggest gainer over the past week and industrial commodities also performing well but some odd ducks like mortgage real estate companies, Brazil, JPY-hedged Japanese equities, and Spain also in the list of the biggest gains over the past week. Natural gas continues to move lower off of recent highs ahead of inventory tomorrow, while the crude market has helped push down high-beta equities that service producing companies. A few Asian EM names, homebuilders, and a couple of other themes round out the worst performers list.

Bespoke provides Bespoke Premium and Bespoke Institutional members with a daily ETF Trends report that highlights proprietary trend and timing scores for more than 200 widely followed ETFs across all asset classes. If you’re an ETF investor, this daily report is perfect. Sign up below to access today’s ETF Trends report.
See Bespoke’s full daily ETF Trends report by starting a no-obligation free trial to our premium research. Click here to sign up with just your name and email address.
Fixed Income Weekly – 10/26/16
Searching for ways to better understand the fixed income space or looking for actionable ideals in this asset class? Bespoke’s Fixed Income Weekly provides an update on rates and credit every Wednesday. We start off with a fresh piece of analysis driven by what’s in the headlines or driving the market in a given week. We then provide charts of how US Treasury futures and rates are trading, before moving on to a summary of recent fixed income ETF performance, short-term interest rates including money market funds, and a trade idea. We summarize changes and recent developments for a variety of yield curves (UST, bund, Eurodollar, US breakeven inflation and Bespoke’s Global Yield Curve) before finishing with a review of recent UST yield curve changes, spread changes for major credit products and international bonds, and 1 year return profiles for a cross section of the fixed income world.
This week we take a look at what forwards are implying for a broad universe of EM currencies.
Our Fixed Income Weekly helps investors stay on top of fixed income markets and gain new perspective on the developments in interest rates. You can sign up for a Bespoke research trial below to see this week’s report and everything else Bespoke publishes free for the next two weeks!
Click here to start your no-obligation free Bespoke research trial now!
Updated Crude Oil and Gasoline Inventory Levels
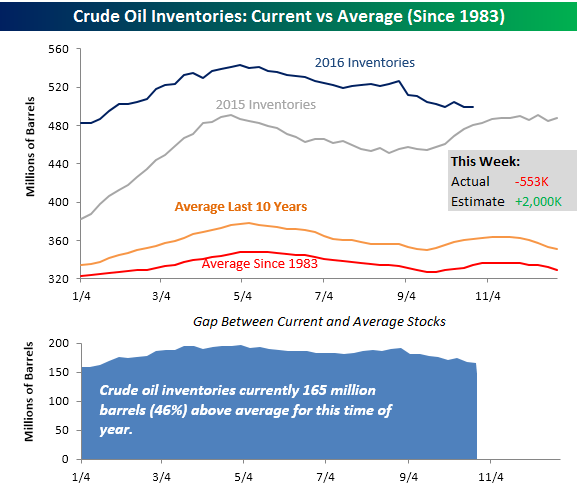
After a surprise build in crude oil inventories as measured by API last night, crude oil inventories as measured by the DoE showed an unexpected decline. While trades were expecting crude inventories to increase by 2 million barrels, they actually fell by 553K. With that decline, crude oil inventories continue to close in on levels they were at this time last year, which was admittedly still above average. In fact, at current levels, crude inventories are 165 million barrels (46%) above their historical average.
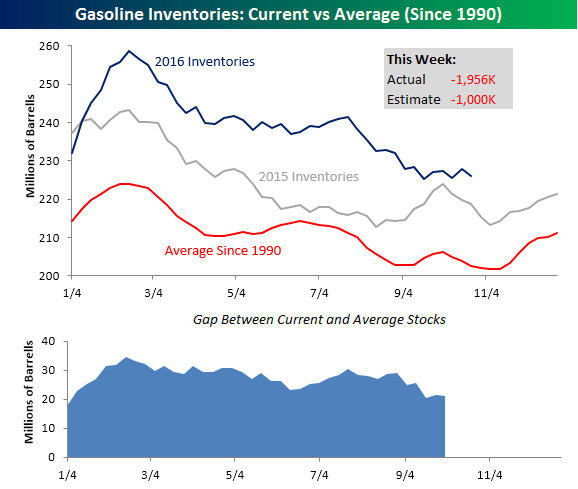
Gasoline inventories also came in lower than expected this week, falling by just under 2 million barrels compared to forecasts for a decline of just one million barrels. As shown in the charts below, gasoline stockpiles are also above average for this time of year but nearing levels they are at this time last year.
Like what you see? Sign up for a free trial to Bespoke’s paid research and receive access to everything we have to offer. No credit card is required.
Bespoke Consumer Pulse Report — October 2016
Bespoke’s Consumer Pulse Report is an analysis of a huge consumer survey that we run each month. Our goal with this survey is to track trends across the economic and financial landscape in the US. Using the results from our proprietary monthly survey, we dissect and analyze all of the data and publish the Consumer Pulse Report, which we sell access to on a subscription basis. Sign up for a 30-day free trial to our Bespoke Consumer Pulse subscription service here.

Rough Day for Stocks Reporting Earnings
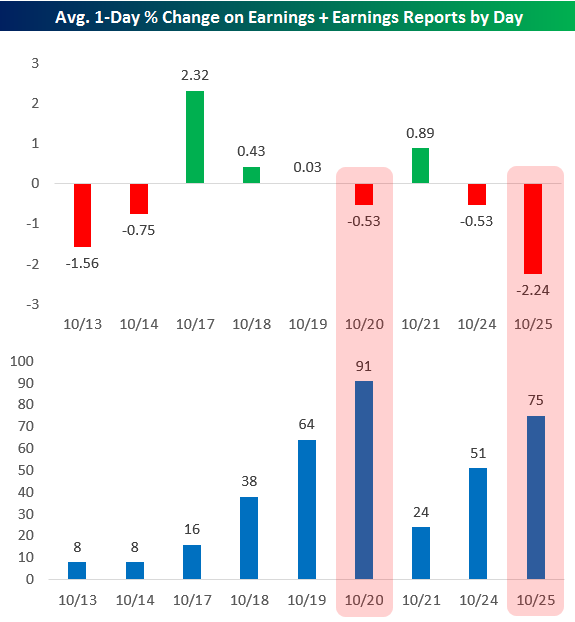
Yesterday morning there were 75 stocks that reported earnings, and on average, these stocks declined 2.24%. That’s an extremely negative number when considering the fact that the S&P 500 only declined 38 basis points on the day. Below is a look at the average one-day performance of stocks reporting earnings by day this earnings season. As shown, the two biggest days for earnings so far have been 10/20 (last Thursday) and 10/25 (yesterday), and on both of these days, the stocks that reported averaged declines. Overall, the average one-day change for all stocks that have reported since earnings season began is now negative at -0.36%. Before yesterday, that average stood at +0.20%, so yesterday we saw a major shift in investor sentiment. It went from investors being willing to “buy the news” to instead selling the news.
Using our Interactive Earnings Report Database, we looked at all trading days since 2001 where more than 50 stocks reported earnings to see how yesterday’s extreme weakness stacks up. We found that there have only been 30 prior trading days where the stocks that reported earnings that morning averaged a decline of more than 2% on the day. And the large majority of those days also saw the broad market post a big decline as well. On only 7 days since 2001 has the average stock reporting earnings that AM fallen more than 2% while the S&P 500 declined less than 1%. Yesterday made it 8 days. While it wasn’t a bad day for the market, it was a horrible day for the stocks that reported earnings.
The Closer 10/25/16 – Chart Buffet—23 Charts & 2 Tables For Tuesday
Looking for deeper insight on global markets and economics? In tonight’s Closer sent to Bespoke clients, we put together 23 different charts and 2 tables summarizing the economic releases of the day and some recent relative performance trends we’ve seen in equity markets.
The Closer is one of our most popular reports, and you can sign up for a trial below to see it and everything else Bespoke publishes free for the next two weeks!
Click here to start your no-obligation free Bespoke research trial now!