The Bespoke Report — 10/28/16
Earnings and Revenue Beat Rates
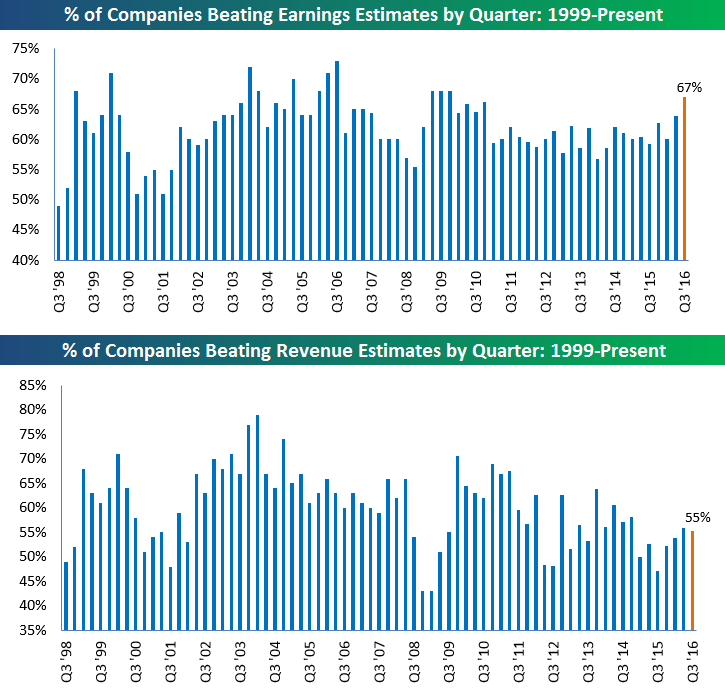
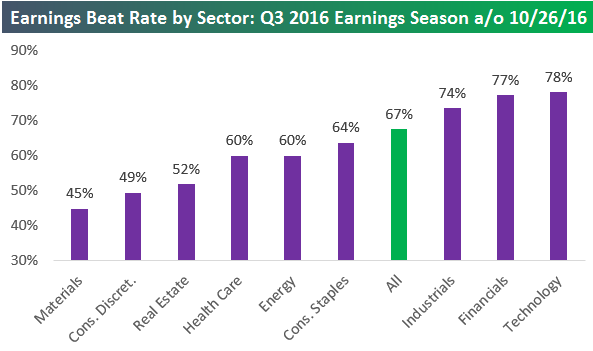
Nearly 1,000 companies have reported earnings so far this earnings season through October 28th, 2016. Of the companies that have reported, 67% have beaten their consensus analyst earnings per share estimates. As shown in the first chart below, that’s a very strong beat rate. If earnings season were to end today, it would be the highest beat rate since Q4 2009.
The top-line revenue beat rate is much lower than the earnings beat rate, however. As shown in the second chart below, just 55% of companies have reported stronger than expected revenue numbers. That’s just a tad lower than the final reading of 56% from last quarter.
Like what you see? Sign up for a free trial to Bespoke’s paid research and receive access to everything we have to offer. No credit card is required.
S&P 500 Sector Performance
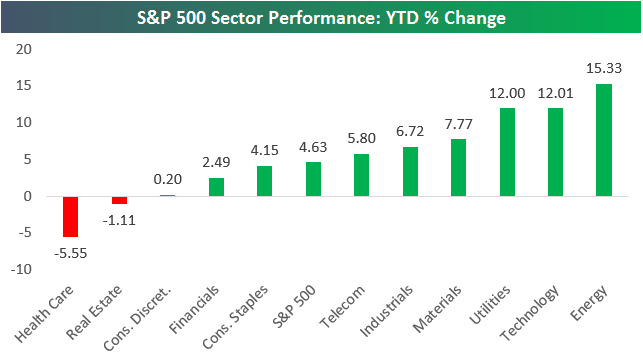
Below are three charts highlighting sector performance so far in 2016. The first shows year-to-date performance, where you can see that Health Care has been the clear laggard with a decline of 5.55%. Real Estate is the only other sector that’s down year-to-date, while Utilities, Technology, and Energy are all up more than 10%.
Like what you see? Sign up for a free trial to Bespoke’s paid research and receive access to everything we have to offer. No credit card is required.
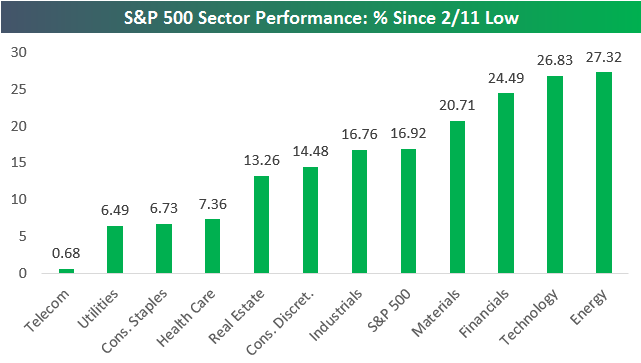
Since the S&P 500 made its 2016 low on February 11th, the index is up 16.92%. Those gains have primarily been driven by Energy, Technology and Financials. Energy is up 27.32%, Tech is up 26.83%, and Financials is up 24.49%. Four sectors have lagged significantly — Telecom, Utilities, Consumer Staples, and Health Care.
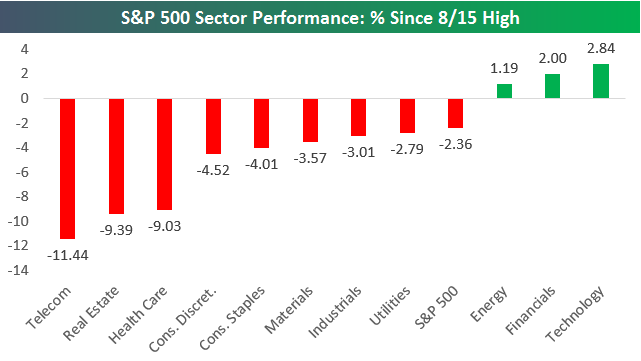
Our final chart shows sector performance since the S&P 500 made its year-to-date (and all-time) high on August 15th. As shown, the S&P as a whole is down 2.36%, but eight of eleven sectors are down more than that, which shows how weak breadth has been. If it weren’t for Tech, Financials, and Energy posting gains over this time period, the S&P would be down a lot more. Tech is by far the biggest sector of the market with a weighting of 21%, and its gain of 2.84% since 8/15 is what has kept the market from completely breaking down. The biggest areas of weakness have been Health Care, Real Estate, and Telecom, which are all down more than 9%.
The Closer 10/27/16 – Homeownership Up, Durable Goods Steady
Looking for deeper insight on global markets and economics? In tonight’s Closer sent to Bespoke clients, we analyze this month’s Durable Goods report from the US Census. We also take a look at the strong quarterly report on the US residential housing market. We also discuss today’s brutal price action for owners of financial assets that saw almost everything but the USD move lower.

The Closer is one of our most popular reports, and you can sign up for a trial below to see it and everything else Bespoke publishes free for the next two weeks!
Click here to start your no-obligation free Bespoke research trial now!
Under Armour’s (UA) Struggles
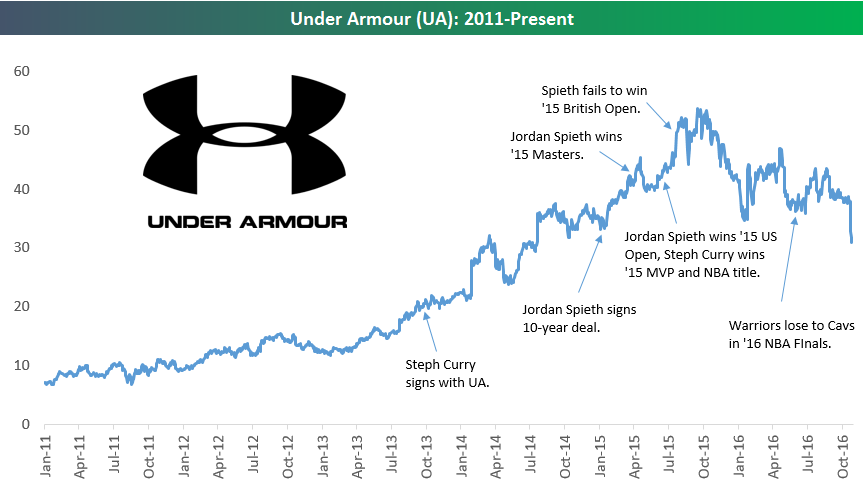
Under Armour (UA) shares are currently in free-fall. Since peaking just above $53 in September 2015, UA shares have now fallen 40%. The last three trading days have been especially painful. On Tuesday the stock fell more than 13% on an earnings report that investors were clearly not happy with. Then we saw downside follow-through both yesterday and today.
2015 was a banner year for Under Armour (UA) — not only for its stock price — but for its two main athletes, Steph Curry and Jordan Spieth. 2016 has been the complete opposite.
Below is a chart of UA that shows Spieth’s and Curry’s spectacular accomplishments in 2015. Spieth signed a 10-year deal with UA in January 2015, then he went on to win the Masters that April. In June, Spieth won back-to-back majors by taking the US Open, and at the same time, Steph Curry was locking up the 2014/2015 NBA MVP award along with his first NBA title with the Warriors.
Things started to turn when Spieth failed to win his third major in a row at the British Open in July 2015. At the time, there was all kinds of talk about Spieth’s chances of completing the “grand slam” in 2015 by winning all four majors, but his failure to win the British Open put that talk to rest. In 2016, Spieth failed to win any majors, and while Steph Curry did win another MVP award in the 2015/2016 NBA season, he suffered a bad loss to Nike’s Lebron James in the Finals this past June.
After this week’s losses, Under Armour shares have now given up all of their 2015 gains. Investors are indeed hoping for some wins again.
Like what you see? Sign up for a free trial to Bespoke’s paid research and receive access to everything we have to offer. No credit card is required.
the Bespoke 50 — 10/27/16
Chart of the Day: Financials Liking the Curve
Bespoke’s Sector Snapshot — 10/27/16
We’ve just released our weekly Sector Snapshot report (see a sample here) for Bespoke Premium and Bespoke Institutional members. Please log-in here to view the report if you’re already a member. If you’re not yet a subscriber and would like to see the report, please start a 14-day trial to Bespoke Premium now.
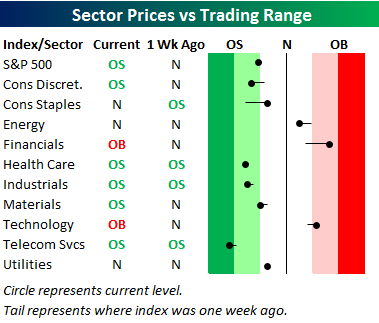
Below is one of the many charts included in this week’s Sector Snapshot, which is our trading range screen for the S&P 500 and its ten sectors. We discuss in more detail how to read the chart in the full version of the report, but basically the dot is where the sector is currently trading, while the tail end is where it was trading one week ago. As shown, the S&P 500 and five sectors are currently oversold, while two sectors — Financials and Technology — are overbought. It’s rare to see Technology, which is the largest sector of the market with an S&P 500 weighting of 21%, in overbought territory while the broad S&P is oversold, but that’s the situation we’re in right now.
To see our full Sector Snapshot with additional commentary plus six pages of charts that include analysis of valuations, breadth, technicals, and relative strength, start a 14-day free trial to our Bespoke Premium package now. Here’s a breakdown of the products you’ll receive.
ETF Trends: US Sectors & Groups – 10/27/16
While headline indices haven’t plunged, breadth withing US equity ETFs is starting to decline notably. As shown, of all the ETFs we track, only 14 are up more than 1% over the past week. In contrast, all of the bottom 20 are down over 2.4%. 30 of the 52 US Sector & Group ETFs we track are in downtrends, with only 15 of the 52 in uptrends. While the decline in breadth isn’t anything apocalyptic, we think it’s a risk factor that should be kept in mind for US equity longs.

Bespoke provides Bespoke Premium and Bespoke Institutional members with a daily ETF Trends report that highlights proprietary trend and timing scores for more than 200 widely followed ETFs across all asset classes. If you’re an ETF investor, this daily report is perfect. Sign up below to access today’s ETF Trends report.
See Bespoke’s full daily ETF Trends report by starting a no-obligation free trial to our premium research. Click here to sign up with just your name and email address.
B.I.G. Tips – Beats Get Beaten
So far this earnings season, 67% of the companies that have reported their quarterly numbers have beaten consensus analyst earnings per share estimates. That’s actually a very strong reading relative to the historical average earnings beat rate. As shown below, sectors like Technology, Financials, and Industrials have posted even stronger beat rates this season. A whopping 78% of Tech stocks have beaten estimates.
Unfortunately for market bulls, the strong beat rate has not translated into higher stock prices. In a B.I.G. Tips report just published for Premium and Institutional subscribers, we look into this phenomenon — explaining why it’s happening and what it might mean for the market and the individual stocks that are getting hit after they report earnings.
To view our just-published B.I.G. Tips report titled “Beats Get Beaten,” sign up for a monthly Bespoke Premium membership and get 10% off for life ($89/month).