Sentiment Up Ahead of October Jobs Report?
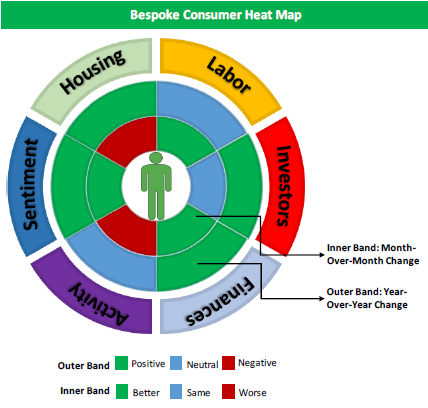
 Each month we run a survey of 1,500 US consumers balanced to census. In the survey, we ask consumers roughly 100 questions about a variety of financial and economic topics regarding both their personal situations and their sentiment on the US economy as a whole. We then break down the results to identify underlying trends or shifts that have yet to show up in the widely followed economic data that’s released throughout the month. If you haven’t yet seen the monthly report that we publish breaking down our survey results, you can see it now for free with a 30-day trial to our Bespoke Consumer Pulse subscription, which is $365/year once you get past the one-month trial. The report features current and historical data on the six topics in the heat map shown below, which is from this month’s survey. It also features analysis on individual stocks like Apple, Amazon, Facebook, Alphabet, Disney, Panera, Chipotle, and pretty much every other key stock you can think of that involves the consumer.
The heat map below is color coded to show month-over-month (inside band) and year-over-year (outer band) trends in the six major areas of focus in our monthly Pulse survey. As you can see, Sentiment and Finances are the two categories in October that saw both MoM and YoY increases, while “Housing” and “Activity” are the only two categories that saw weakness month-over-month. With respect to the Labor market ahead of Friday’s employment report, while conditions are neutral relative to last year at this time, on a MoM basis, conditions have improved. If you’d like to see the underlying analysis (charts and commentary) that goes along with this heat map, sign up for the 30-day free trial we mentioned above.
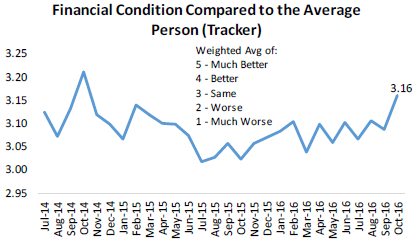
There are literally hundreds of charts like the one below in our monthly report, but we wanted to show you this one as an example of a unique question asked in our survey. In this question, we ask survey takers to rate their current financial condition with the average person. As shown, we’ve seen a big pick-up in this reading over the last few months after it bottomed in late 2015. In reality, more than 50% of survey takers can’t be better than average, but when this reading is above 3, it suggests that more than 50% of consumers feel like they’re better off than the average. That’s a positive in our view.
Fixed Income Weekly – 11/2/16
Searching for ways to better understand the fixed income space or looking for actionable ideals in this asset class? Bespoke’s Fixed Income Weekly provides an update on rates and credit every Wednesday. We start off with a fresh piece of analysis driven by what’s in the headlines or driving the market in a given week. We then provide charts of how US Treasury futures and rates are trading, before moving on to a summary of recent fixed income ETF performance, short-term interest rates including money market funds, and a trade idea. We summarize changes and recent developments for a variety of yield curves (UST, bund, Eurodollar, US breakeven inflation and Bespoke’s Global Yield Curve) before finishing with a review of recent UST yield curve changes, spread changes for major credit products and international bonds, and 1 year return profiles for a cross section of the fixed income world.
In our weekly charts this week we take a look at the relationship between inflation breakevens and a number of other assets and bond market relationships.

Our Fixed Income Weekly helps investors stay on top of fixed income markets and gain new perspective on the developments in interest rates. You can sign up for a Bespoke research trial below to see this week’s report and everything else Bespoke publishes free for the next two weeks!
Click here to start your no-obligation free Bespoke research trial now!
Crude Cracks
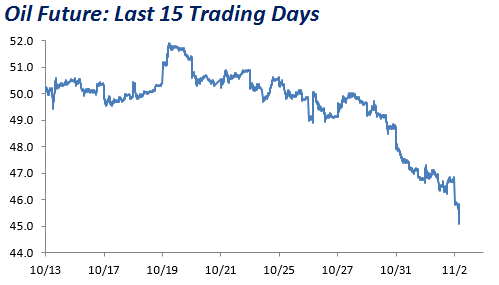 It sure hasn’t been a good two weeks for crude oil. After kissing the $52 level in mid to late October, the commodity has been in a practical free-fall for the last several days and is now barely hanging on to the $45 level. That works out to a 14% decline in two weeks. The culprit for today’s weakness was an extremely bearish inventory report from the Department of Energy (DoE). Even as traders were prepared for some upside to consensus forecasts after yesterday’s report from API showed the biggest build in stockpiles since March, they weren’t prepared for this.
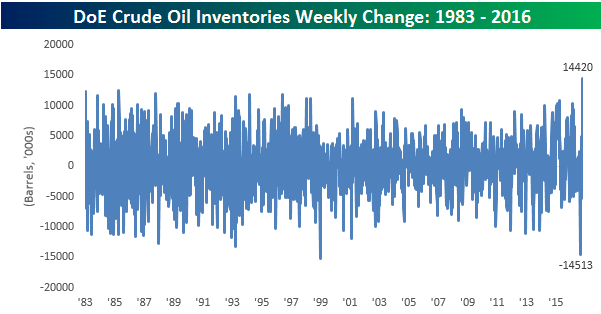
According to the DoE, crude oil inventories increased by a whopping 14.42 million barrels compared to expectations for a decline of 532K barrels. As shown in the chart below, this week’s increase in stockpiles represents the largest one-week increase going back to at least 1983. Looking at the chart, it is interesting to note that just eight weeks ago we saw one of the largest weekly drawdowns in inventories going back to 1983, so if you net them out you could say its a wash.
Looking at where inventory levels stand now, while stockpiles were approaching their levels from this time last year, this week’s increase moved that convergence off course. From a longer-term perspective, though, stockpiles were and remain at extraordinarily above average levels. As shown in the bottom chart, inventories are currently more than 177 million (49%) above their historical average going back to 1983.

ETF Trends: Hedge – 11/2/16
With oil inventories coming in with their biggest week-over-week gain in history today (+14mm barrels) WTI has gotten absolutely smoked, down over 10% from recent highs. The Energy sector has taken a massive hit over the past week and the worst performers list is littered with those names. The Mexican peso has made new lows thanks to event risk around the US election, helping EWW pop up among the worst performers. Precious metals dominate the best performers list, with industrial metals also faring well. Despite the risk-off tone in many markets the dollar is down notably WoW, with the Japanese yen getting more of a risk-off gain.

Bespoke provides Bespoke Premium and Bespoke Institutional members with a daily ETF Trends report that highlights proprietary trend and timing scores for more than 200 widely followed ETFs across all asset classes. If you’re an ETF investor, this daily report is perfect. Sign up below to access today’s ETF Trends report.
See Bespoke’s full daily ETF Trends report by starting a no-obligation free trial to our premium research. Click here to sign up with just your name and email address.
Chart of the Day – Does it Pay to Wait?
Dynamic Upgrades/Downgrades: 11/2/16
October 2016 Headlines
The Closer 11/1/16 – Election Pricing
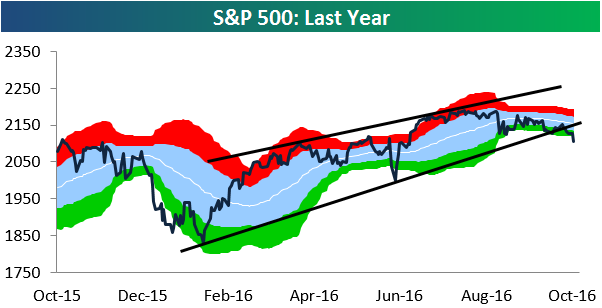
Looking for deeper insight on global markets and economics? In tonight’s Closer sent to Bespoke clients, we analyze volatility pricing, which has started to perk up around the date of the election. We also take a look at S&P technicals after today’s selloff and break down the US Census’ Construction Spending report for the month of September.
The Closer is one of our most popular reports, and you can sign up for a trial below to see it and everything else Bespoke publishes free for the next two weeks!
Click here to start your no-obligation free Bespoke research trial now!
B.I.G. Tips – Six-Day Losing Streak as Election Looms
The S&P 500 fell 0.68% today to register its sixth consecutive decline. Today was also just the 16th time in the S&P’s 89-year history that it fell more than 0.50% on the first trading day of November.
In a B.I.G. Tips report just published for Premium and Institutional subscribers, we analyze prior six-day losing streaks and weak starts to November to see if the market typically continues lower or bounces back. We also provide commentary on the upcoming election and how to position ahead of next Tuesday. This report is a must-read for anyone looking for guidance after a rough few weeks for stocks.
To view our just-published B.I.G. Tips report titled “Six-Day Losing Streak as Election Looms,” sign up for a monthly Bespoke Premium membership and get 10% off for life ($89/month).
B.I.G. Tips — Buy the Winning Sectors or the Losers?
The last two months of 2016 certainly aren’t getting off to a very good start for anyone who is long equities. For the majority of managers out there who are already underperforming, a day like today only digs the hole a little deeper.
Through the first ten months of 2016, the two top performing sectors in the S&P 500 are Utilities and Energy. Right behind those two, Technology rounds out the top three and is the only other sector that saw a double-digit percentage gain through 10/31. On the downside, Health Care and Consumer Discretionary are the only two sectors in the red this year. Along with these two, the only other sector underperforming the S&P 500 YTD is Financials (+1.9%). Had you asked a random group of investors back in January which sectors would do the best and worst in 2016, we would bet that more people would have expected Utilities and Energy to be on the list of losers than winners. Conversely, at the end of 2015, Health Care (especially biotechs) and Consumer Discretionary were among two of the most loved sectors in the market.
Now that 2016 has essentially emasculated the confidence of most portfolio managers, heading into the last two months of the year, which sectors should investors be looking to add exposure to in order to outperform? Do the sectors that were already winning typically maintain their strength to close out the year, or do investors look to the losers for a rebound. In a B.I.G. Tips report just published for Premium and Institutional subscribers, we looked at sector returns going back to 1990 in order to see what patterns the best and worst performing sectors through 10/31 exhibit in the final two months of the year.
To view our just-published B.I.G. Tips report titled “Buy the Winning Sectors or the Losers?,” sign up for a monthly Bespoke Premium membership and get 10% off for life ($89/month).