October Employment Report Preview
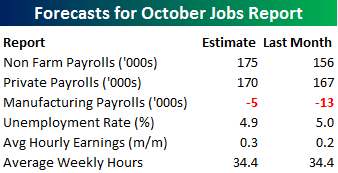 Heading into Friday’s Non Farm Payrolls (NFP) report for October, economists are expecting an increase in payrolls of 175K, which would be a 19K increase from last month’s weaker than expected reading of 156K. In the private sector, economists are expecting an increase of 170K, which would be a similar improvement as the overall headline reading. The unemployment rate is forecasted to improve slightly back down to 4.9% from last month’s reading of 5.0%. Growth in average hourly earnings is expected to accelerate back up to 0.3%, while hours worked is forecast to remain unchanged at 34.4. It’s still early, but data that we have seen so far covering the month of October has shown weaker momentum from September. Following Friday’s report, we should have a much better read on how economic activity is shaping up for the month of October.
With such high stakes surrounding the report, the market will likely have a big reaction to the upside or downside based on how the number comes in relative to expectations. To that end, we just published our eleven-page monthly preview for the October jobs report. This report contains a ton of analysis related to how the equity market has historically reacted to the monthly jobs report, as well as how secondary employment-related indicators we track looked in September. We also include a breakdown of how the initial reading for September typically comes in relative to expectations and how that ranks versus other months.
For anyone with more than a passing interest in how equities are impacted by economic data, this report is a must read. To see the report, sign up for a monthly Bespoke Premium membership and get 10% off for life ($89/month).
Earnings Triple Plays Report — 11/3/16
Here at Bespoke, our job is to identify winners and losers, and one of the ways we try to find earnings-season winners is through our list of “triple plays.”
Long-term Bespoke subscribers know how much we like triple plays, but for those that haven’t heard of the term, we came up with it back in the mid-2000s for companies that beat analyst earnings estimates, beat analyst revenue estimates and also raise guidance. Investopedia.com is one of the best online resources for financial markets education, and they’ve actually given us credit for coining the “triple play” term on their website. We consider triple play stocks to be the cream of the crop of earnings season, and we are constantly finding new long-term buy opportunities from this basket of names each quarter.
There have been a total of 76 “triple plays” so far this season out of more than 1,700 earnings reports. Throughout earnings season, Bespoke sends Premium and Institutional members its “Earnings Triple Plays Report.” The report keeps a running tally of recent triple plays, and it also provides a list of “Top Triple Plays.” We’ve just published our first Earnings Triple Plays Report for this earnings season, featuring a list of the 76 stocks that have registered triple plays this earnings season plus the 17 that we’ve identified as having the most attractive chart patterns. Learn how to see the stocks below!
See our Top Earnings Season Triple Plays by signing up for a monthly Bespoke Premium membership now. Click this link for a 14-day free trial.
ISM Services Comes Up Short
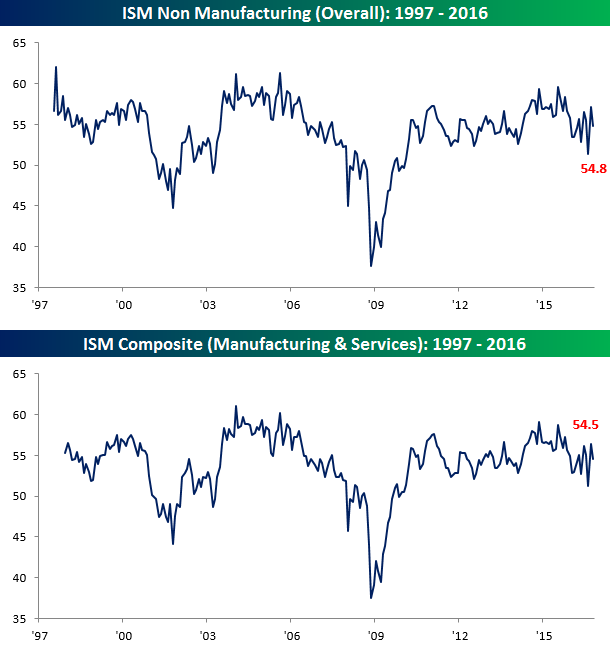
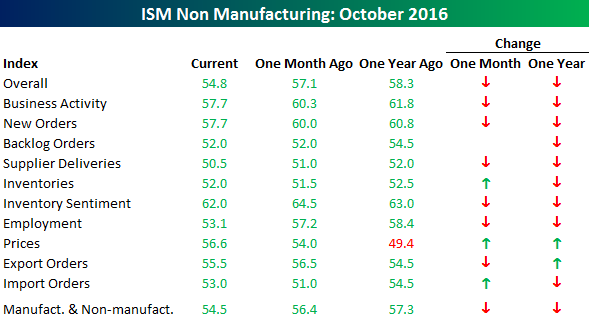
As has become a trend in the last several days, another economic indicator covering the month of October came up short of expectations. The most recent example is the ISM Non-Manufacturing report. While economists were expecting a headline reading of 56.0 versus last month’s reading of 57.1, the actual reading came in at 54.8. Yes, the report was weaker than expected, but it comes after last month’s print which showed the largest m/m increase in the history of the survey. On a combined basis and accounting for each sector’s share of the overall economy, the October ISM came in at a level of 54.5 compared to last month’s reading of 56.4. Again, that decline also came on the heels of the largest one-month increase on record in September. Looking at the charts of both indices, current levels are right in the middle of their range of the last few years.
As far as the internals of the report are concerned, things were, for the most part, weak. While every category is in expansion mode (above 50), the only ones that showed a month/month increase were Inventories, Prices, and Import Orders. Compared to a year ago, breadth was similarly weak with just Prices and Export Orders showing a year/year increase. With the October employment report coming up tomorrow, it was especially noteworthy that the category that showed the largest m/m and y/y decline was Employment.
the Bespoke 50 — 11/3/16
Sentiment Little Changed Ahead of Election
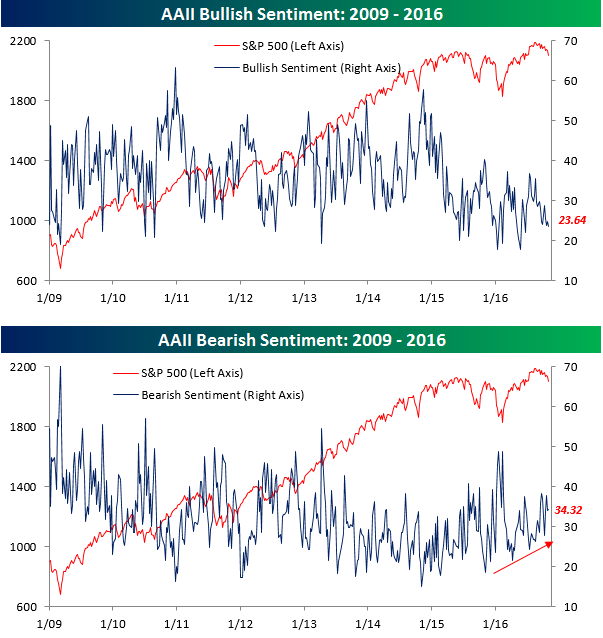
With just five days to go until the election and the S&P 500 in the midst of a seven-day losing streak, sentiment on the part of individual investors only declined modestly this week. That being said, with sentiment already at such depressed levels, it would be hard to get much more negative. According to the weekly survey from AAII, bullish sentiment dropped from 24.75% down to 23.64%. This is the lowest weekly reading since late June leading up to the Brexit vote, and represents the 53rd straight week below 40%. Bearish sentiment, meanwhile, saw an extremely modest increase, rising to 34.32% from 34.07%. We would like to say that once the election passes that investor sentiment will start to improve, but no matter who wins, that attitude may be a little on the optimistic side.
Jobless Claims Miss Expectations for the Third Straight Week
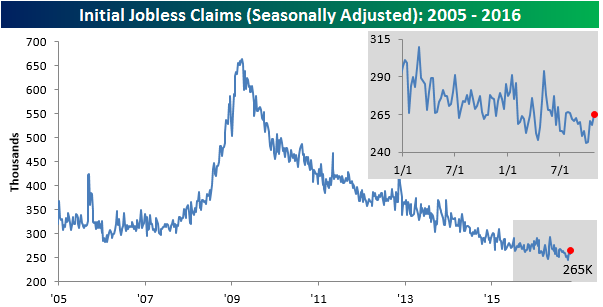
Jobless claims came in higher than expected this week hitting a level of 265K compared to expectations for 256K. That’s the highest weekly reading since the first week of August. Additionally, after nine straight weeks where jobless claims came in lower than expected, this week’s higher than expected reading represents the third straight miss. Even after this week’s increase, jobless claims are still at extraordinarily low levels and have yet to even make a higher high, but when claims eventually do start rising, it will have to start from somewhere. Whether or not it is from these levels remains to be seen.
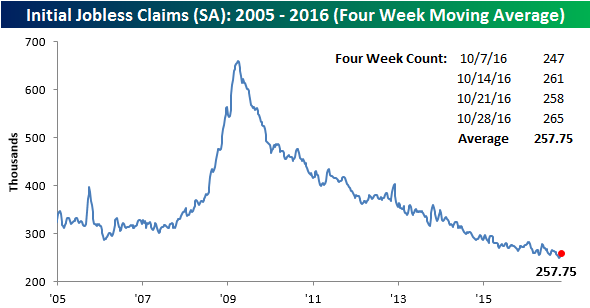
With this week’s increase, the four-week moving average increased to 257.75K from 253K. This is 8.25K above the post-recession low of 249.5K hit earlier this month.
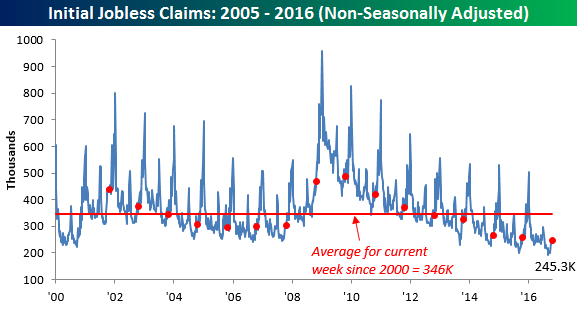
On a non-seasonally adjusted (NSA) basis, claims increased by just under 9K to 245.3K. Despite the increase, this level is more than 100K below the historical average for this current week of the year going back to 2000. In fact, you still have to go back to 1973 to find a year where claims for the current week of the year were lower than they are now.
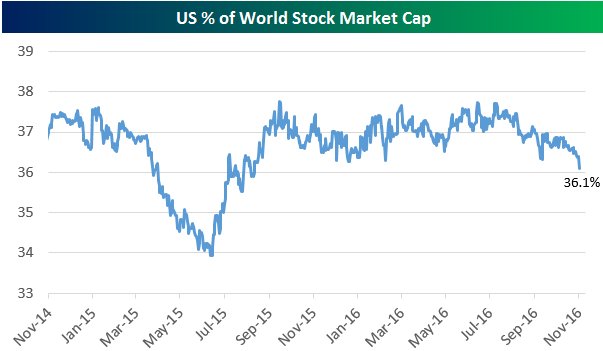
US Loses Market Share as Stocks Underperform Rest of World
With the US underperforming other markets around the world over the last few weeks, we’ve seen its percentage of world equity market cap begin to dip and break down. In mid-2016, the US made up nearly 38% of world market cap, but as shown below, as of yesterday this reading had dipped to 36.1%. That’s the lowest level seen since mid-July, and it’s further indication that election hedging is causing a lot of the recent weakness for stocks.
The Closer 11/2/16 – Fed Hits Snooze, Oil Imports Are Back
Looking for deeper insight on global markets and economics? In tonight’s Closer sent to Bespoke Institutional clients, we recap the FOMC policy decision today. The announcement has helped cement pricing of a hike in December. We also discuss the weekly EIA petroleum market status report.

The Closer is one of our most popular reports, and you can see it and everything else Bespoke publishes by starting a no-obligation 14-day free trial to our research!
B.I.G. Tips – Seven-Day Losing Streaks
US One of Three Most Oversold Markets
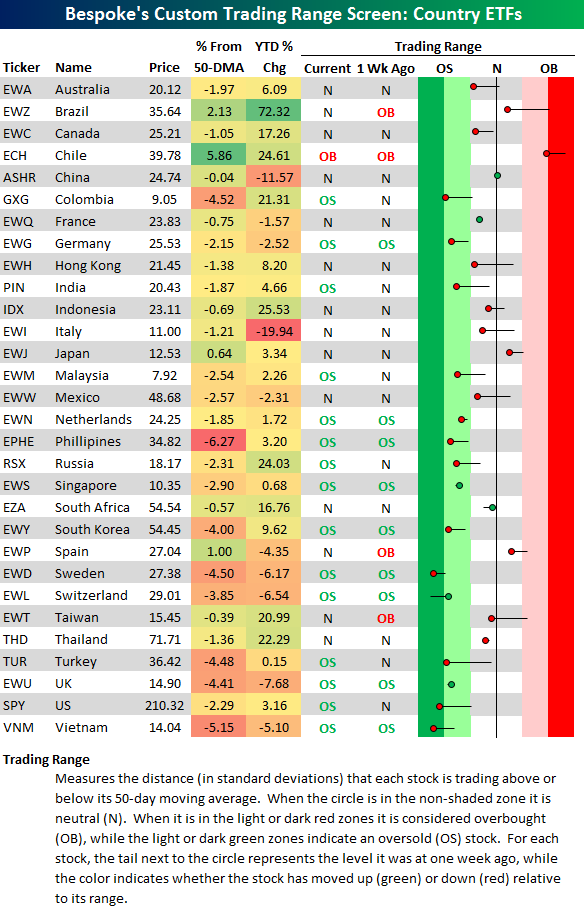
Below is an updated look at our country trading range screen featuring the 30 largest country ETFs traded on US exchanges. For each ETF, the dot represents where it’s currently trading, while the tail end represents where it was trading one week ago. Moves into the green zone are considered oversold, while moves into the red zone are considered overbought.
Global investors certainly don’t have to worry about overbought markets right now, as just one country (Chile) is trading in overbought territory. Plenty of countries are oversold, however. As shown below, 15 of 30 countries are at oversold levels, with Sweden, Vietnam, and the US the most extended to the downside.
The US is usually an area of the world that holds up better than most when global markets decline in tandem, but this time the US is leading the way. This is a pretty good indication that election worries here in the US have been a primary driver of the declines in recent days.