Job Openings Stable, New Low For Firings
As we noted last month, there appears to be a fair degree of seasonality in the job openings numbers reported by the BLS each month. In September, openings rose modestly, in-line with the seasonal trend we highlighted a month ago. This month, openings came in almost right at expectations, totaling 5.486 million positions. The separation rate trended lower, though we should note that wasn’t because of quits, which were stable MoM (more on that below).
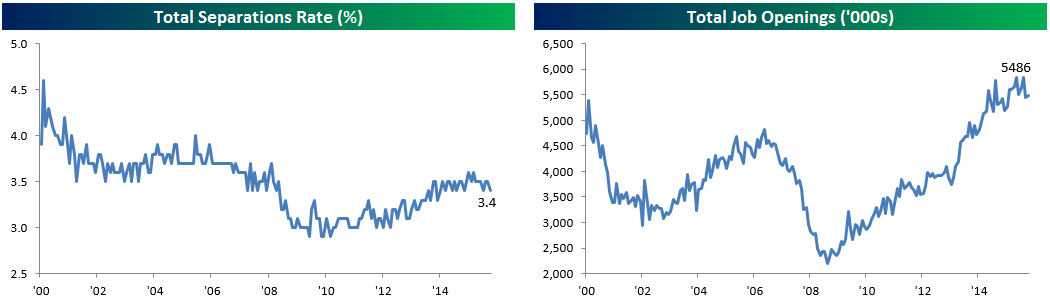
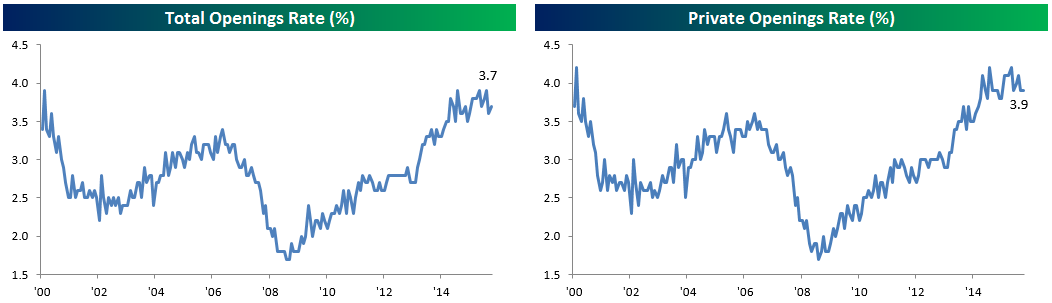
The openings rate also ticked up MoM to 3.7%, though that was entirely due to government workers; the private sector saw an openings rate unchanged from August at 3.9%.
Quits have not risen dramatically over the last couple of months but are broadly trending higher. As shown below, in September quits were unchanged from revised August figures in both the whole economy and the private sector only.

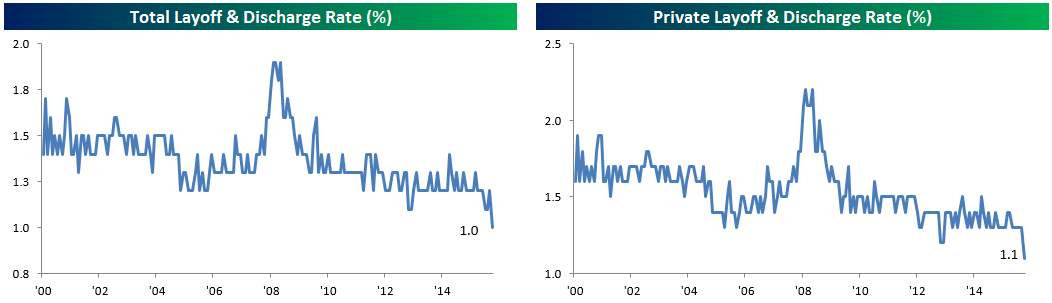
The real news this month (in our view) was the frankly shocking lack of firings and layoffs. Both the private sector and the whole economy made record lows for layoffs and discharges, broadly confirmed by data from the weekly initial jobless claims data and the monthly Employment Situation Report figures. It’s also worth noting that the trend for both these figures has been consistently lower, though we wouldn’t be surprised to see some negative revisions (higher rate) in coming months.
At the industry level, quit rates ticked up in Food Services (which has enjoyed extremely strong wage growth in recent months) and Transportation, but remain extremely low in the Construction industry despite a very low level of unemployment for that class of worker. On a regional basis, all major Census regions saw sequentially lower layoff rates with the South and Midwest setting new record lows.
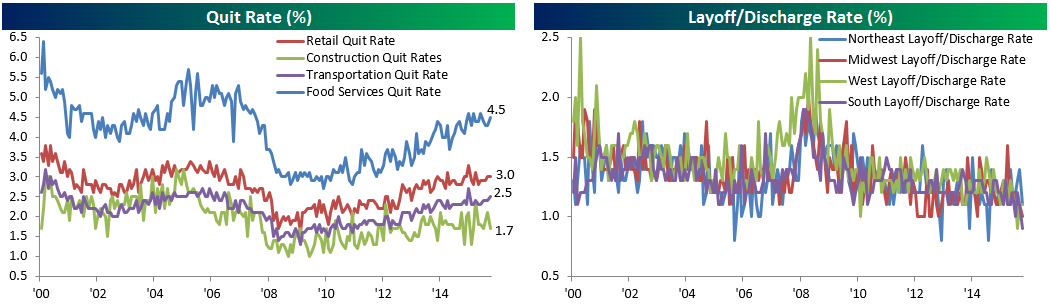
Chart of the Day: S&P 500 Bounces Off 200-DMA
Looking Past Election Day
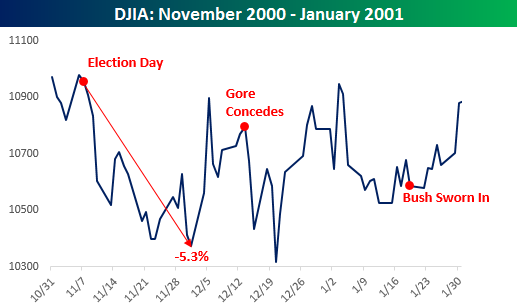 We just published a useful summary for clients of market returns in different sessions of Congress based on the political makeup of Washington, but what if the results of the vote are so close that we don’t have a winner tomorrow morning? Hopefully that isn’t the case (especially now that the Supreme Court is split right down the middle), but if that kind of scenario does unfold, the reaction of the markets likely wouldn’t be good. The chart to the right shows the performance of the DJIA following the 2000 election which wasn’t decided until well after Election Day. During that period of uncertainty, the DJIA declined 5.3% from the Election Day close to its low on 12/1/00. What is interesting to note, though, is that even with the uncertainty, on the day after the election in 2000, the DJIA only declined 45 points (0.41%). We can only imagine if that type of scenario played out this year, instead of a 45 point decline, we would be looking at a decline of more like 450 points.
If you are interested in seeing our latest B.I.G. Tips report, Looking Past Election Day, sign up for a monthly Bespoke Premium membership and get 10% off for life ($89/month). There is no financial obligation whatsoever, and you can cancel at any time.
Bespoke Stock Scores: 11/8/16
ETF Trends: US Indices & Styles – 11/8/16
Coffee continues to surge, pacing all ETF gains despite a drop today. XME is breaking a five year downtrend, up 3.5% on strong iron ore price gains recently, while Transports exploded higher yesterday only to fall after a brutal report from HTZ this morning (which has spilled over to other transport names). New Zealand and Mexico have both rallied recently after large drops. In the worst performers list, natural gas continues to contend with brutal warm weather forecasts, Turkey struggles with political risk, and oil-related ETFs decline.

Bespoke provides Bespoke Premium and Bespoke Institutional members with a daily ETF Trends report that highlights proprietary trend and timing scores for more than 200 widely followed ETFs across all asset classes. If you’re an ETF investor, this daily report is perfect. Sign up below to access today’s ETF Trends report.
See Bespoke’s full daily ETF Trends report by starting a no-obligation free trial to our premium research. Click here to sign up with just your name and email address.
The Best Performing Stocks Since the 2012 and 2008 Elections
Election Day 2016 is here, marking the start of the end for Obama’s Presidency. Let’s take a look back at stock market performance since the 2008 and 2012 elections to see where things stand.
Since Election Day 2012 on 11/6/12, the Russell 1,000 is up 49%. And keeping in mind that this has quite a bit of survivorship bias, the current members of the Russell 1,000 are up an average of 68% since Election Day 2012.
Below is a list of the 40 best performing Russell 1,000 stocks since the close on Election Day 2012. As shown, Netflix (NFLX) reigns supreme with a gain of 1,041%. In second place stands Acadia Pharmaceuticals (ACAD) with a gain of 940%. Keep in mind that ACAD was at $50 in July 2015, so even after being cut in half, it’s still up nearly 1,000% since the 2012 election. ABIOMED (ABMD) ranks third with a gain of 699%, and then Tesla (TSLA) ranks fourth at +518%. Tesla is the best performing stock since Election Day 2012 that wasn’t in existence as a public company on Election Day 2008.
Other notables in the top 10 include Electronic Arts (EA), Facebook (FB), Diamondback Energy (FANG), Rite Aid (RAD), and NVIDIA (NVDA). Diamondback Energy is the only Energy stock in the top 40, and there are no Materials names on the list. You won’t find many Financial sector stocks on the list either. MarketAxess (MKTX) and Western Alliance (WAL) are the only two Financial stocks that made the cut, and noticeably missing are some of the bigger banks and brokers that have been stagnant for the last four years.
You may have expected to see Amazon.com (AMZN) higher on the list given the huge run it has had over the last year or two, but it ranks 36th overall with a gain of 231% since Election Day 2012.

Election Day 2008 came at a time when financial markets were in turmoil, and given that the bottom of an epic crash came just under five months after the election, there are some huge, huge gains since President Obama claimed victory in Grant Park on November 4th, 2008. This has even more survivorship bias than the 2012 data above, but of the current Russell 1,000 members, the average stock is up 234% since Election Day 2008. As shown below, media-company Starz (STRZA) has been the top performing stock since 11/4/08 with a gain of 4,225%. At the close that day, STRZA was at $0.76/share, and now it’s at $32.78.
Netflix (NFLX) ranks as the #1 stock since Election Day 2012, and it has been the 2nd best performing stock since Election Day 2008 with a gain of 3,527%. In total, there are 22 Russell 1,000 stocks up more than 1,000% (the proverbial “10-bagger”) since Election Day 2008, including names like Priceline (PCLN), Domino’s Pizza (DPZ), Ulta Salon (ULTA), Expedia (EXPE), Sirius (SIRI), Amazon.com (AMZN), and Align Technology (ALGN). If you’ve managed to hold onto any of these stocks for the entirety of the last 8 years, congrats on the big gains!

NFIB Small Business Sentiment Improves
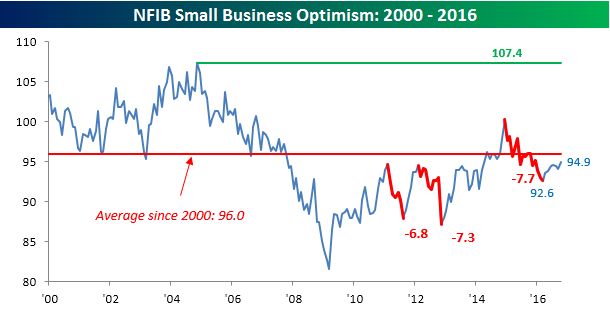
While much of the economic data thus far for October has been weaker than expected, at least sentiment on the part of small businesses is improving. According to this month’s NFIB Small Business Sentiment survey, overall sentiment improved from 94.1 up to 94.9 and came in ahead of the 94.1 consensus estimate. Even after this month’s increase, overall sentiment on the part of small businesses remains below its average level of 96.0 since 2000, and nowhere near the current cycle’s high of 100.3 seen at the end of December 2014.
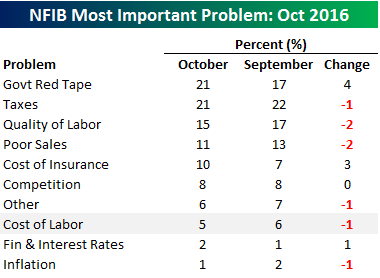 The table to the right breaks down the issues that small businesses are currently citing as the biggest problems they face. At the top of this month’s list are Government Red Tape and Taxes, which were each cited by 21% of the business surveyed. Next on the list was Quality of Labor (15%) and then Poor Sales (11%), both of which were cited by fewer businesses than they were last month. Given the election this month and the fact that most political ads are focused on what is wrong with Washington, it is not a surprise that issues with government regulation are at the forefront of business owners’ minds, but it is clearly having an impact. As noted in this month’s report, “Of those who think the current period is a bad time to expand substantially (56 percent), a record high 39 percent blame the political climate, second only to economic conditions.”
Dynamic Upgrades/Downgrades: 11/8/16
The Closer 11/7/16 – SLOOS Update, Consumer Credit, And Voting Vol
Looking for deeper insight on global markets and economics? In tonight’s Closer sent to Bespoke Institutional clients, we update our tracking of the Fed’s Senior Loan Officers’ Survey. We also discuss consumer credit growth for the month of September, and discuss volatility markets ahead of election day.

The Closer is one of our most popular reports, and you can see it and everything else Bespoke publishes by starting a no-obligation 14-day free trial to our research!