B.I.G. Tips – Eli Lilly’s Wicked Wednesday
Quick View Chart Book – 11/25/16
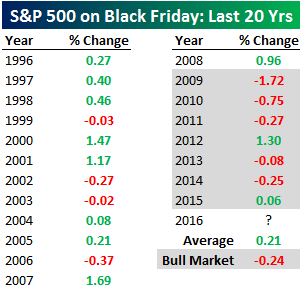
S&P 500 Performance on Black Friday: Last 20 Years
Like our free content? You’ll like Bespoke Premium even more! Click here to start a 14-day free trial now.
For those that made it into the office today, below is a look at the S&P 500’s trading pattern on Black Friday over the last 20 years. While the index performed really well on Black Friday from 1996 through 2008, it has traded down more often than not during the current bull market that began in 2009. Over the entire 20 year period, the S&P has averaged a gain of 0.21% on Black Friday, but during the current bull market, the index has averaged a Black Friday decline of 0.24%.
Bull Camp Expands For Third Straight Week
Like our free content? You’ll like Bespoke Premium even more! Click here to start a 14-day free trial now.
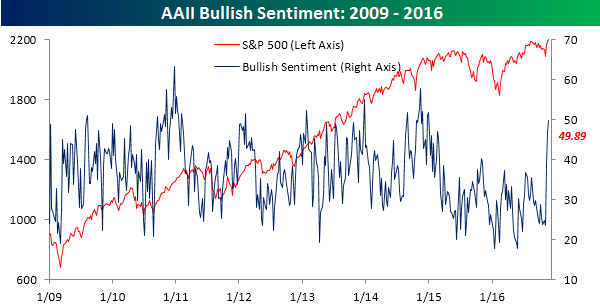
The post-election surge in individual investor optimism continued this week as AAII Bullish Sentiment increased from 46.7% up to 49.9%. So after finally breaking above 40% for the first time in 54 weeks last week, now it is testing 50%! This week’s increase in bullish sentiment is the highest weekly reading since January 2015 and the largest three-week increase (26.25 percentage points) in over six years. Think about it this way — in the last three weeks, bullish sentiment has more than doubled!
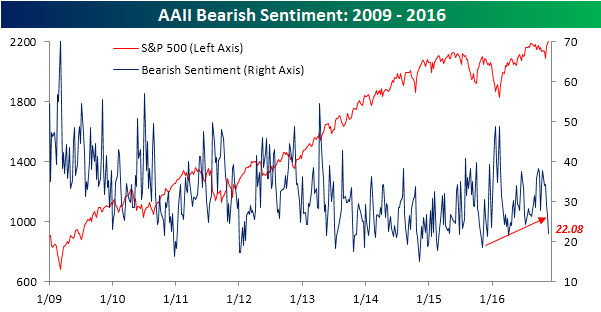
Given the large increase in bullish sentiment, bearish sentiment has shrunk of course. In this week’s survey, bearishness came in at 22.08%, which is the lowest reading since April of this year. While not nearly as notable as the move for bullish sentiment, the trend of higher readings that has been in place since late last year has clearly been broken.
Bespoke CNBC Appearance (11/22/16)
Click here to start a 14-day free trial now.
Bespoke co-founder Paul Hickey appeared on CNBC’s Closing Bell on Tuesday (11/22) to discuss the market’s initial reaction to the Trump election and what it may portend for the market going forward. To watch the segment, please click on the image below.
Chart of the Day: A Boost for Boats?
The Most “So So” Time of the Year (For Retailers)
 It’s that time of year again. With Thanksgiving here, the mad dash of holiday shopping season kicks off in earnest this weekend. While the holidays are the time of year where retailers make most of their money, it has historically been a time of year where investors in retail stocks underperform.
The chart to the right compares the relative strength of the S&P 500 Retail Group to the S&P 500 this year to a composite of its typical pattern going back to 2000. Looking at the chart, the Retail group’s relative performance this year hasn’t exactly followed the typical pattern. Whereas, the group typically outperforms steadily from the start of the second half of the year through Thanksgiving (red dot), it tends to give up some of that ground as the year comes to a close. Even this year, where the typical pattern hasn’t held, we have seen a big jump in relative returns in the post-election period. Will the typical pattern hold, or will the big surge in Consumer sentiment in the post-election period turn the tide. We covered all of this and more in our most recent B.I.G. Tips report, including a look at the retail related stocks that typically perform best from Thanksgiving through year end.
If you are interested in seeing our latest B.I.G. Tips report, Retail’s Most So-So Time of the Year, sign up for a monthly Bespoke Premium membership and get 10% off for life ($89/month). There is no financial obligation whatsoever, and you can cancel at any time.
Fixed Income Weekly – 11/23/16
Searching for ways to better understand the fixed income space or looking for actionable ideals in this asset class? Bespoke’s Fixed Income Weekly provides an update on rates and credit every Wednesday. We start off with a fresh piece of analysis driven by what’s in the headlines or driving the market in a given week. We then provide charts of how US Treasury futures and rates are trading, before moving on to a summary of recent fixed income ETF performance, short-term interest rates including money market funds, and a trade idea. We summarize changes and recent developments for a variety of yield curves (UST, bund, Eurodollar, US breakeven inflation and Bespoke’s Global Yield Curve) before finishing with a review of recent UST yield curve changes, spread changes for major credit products and international bonds, and 1 year return profiles for a cross section of the fixed income world.
In this week’s note, we take a look at the rather benign reaction to the recent move up in rates from mortgage spreads.

Our Fixed Income Weekly helps investors stay on top of fixed income markets and gain new perspective on the developments in interest rates. You can sign up for a Bespoke research trial below to see this week’s report and everything else Bespoke publishes free for the next two weeks!
Click here to start your no-obligation free Bespoke research trial now!
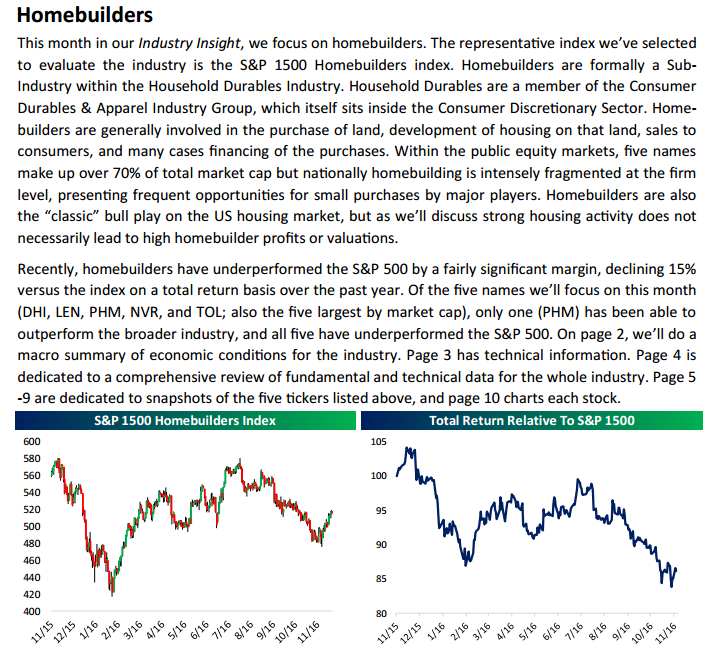
Introducing Bespoke’s New “Industry Insights” Report — Homebuilders — 11/23/16
Yesterday evening we emailed a new monthly report to Bespoke Institutional subscribers. Our new “Industry Insights” report provides more in-depth industry/sector/group coverage than we’ve previously offered. In our first edition, we take a look at Homebuilders. Over the next few months, we’ll be publishing reports on more industries until we build a pretty extensive coverage list. Keep in mind that this is the first version, and we plan on tweaking and improving the report over time.
Below is a snapshot of the first page of the report. To access the full 10-page PDF, sign up for a two-week free Bespoke research trial today. In addition to this report, you’ll also receive everything else we publish on a daily basis, starting with our Morning Lineup and finishing with The Closer each night.
ETF Trends: Hedge – 11/23/16
Metals and steel-related ETFs have performed well over the last few days, after pausing briefly last week. Energy also continues to perform well ahead of EIA data on the petroleum market today. Duration continues to underperform with EDV, TLT, and VCLT all on the list of worst performers. Parts of Health Care also continue to underperform as do solar stocks and gold.

Bespoke provides Bespoke Premium and Bespoke Institutional members with a daily ETF Trends report that highlights proprietary trend and timing scores for more than 200 widely followed ETFs across all asset classes. If you’re an ETF investor, this daily report is perfect. Sign up below to access today’s ETF Trends report.
See Bespoke’s full daily ETF Trends report by starting a no-obligation free trial to our premium research. Click here to sign up with just your name and email address.