Dynamic Upgrades/Downgrades: 11/30/16
The Closer 11/29/16 – Confidence Corral
Log-in here if you’re a member with access to the Closer.
Looking for deeper insight on global markets and economics? In tonight’s Closer sent to Bespoke Institutional clients, we take a look at the Conference Board consumer confidence survey released today, as well as weekly Gallup confidence figures and a review of today’s GDP revisions released by the BEA.

The Closer is one of our most popular reports, and you can see it and everything else Bespoke publishes by starting a no-obligation 14-day free trial to our research!
ETF Trends: International – 11/29/16
Oil plunged today ahead of tomorrow’s OPEC announcement, with markets positioning for no agreement on production cuts by the cartel. Exploration and production companies, MLPs, and other related ETFs litter the list of the worst performers over the past week, with biotech and gold also performing poorly. On the other side of the coin natural gas has surged higher over the last few days while base metals, steel, China, and India have performed well. Also sneaking back some performance: REITs, which had gotten absolutely smashed along with bonds following the US election.

Bespoke provides Bespoke Premium and Bespoke Institutional members with a daily ETF Trends report that highlights proprietary trend and timing scores for more than 200 widely followed ETFs across all asset classes. If you’re an ETF investor, this daily report is perfect. Sign up below to access today’s ETF Trends report.
See Bespoke’s full daily ETF Trends report by starting a no-obligation free trial to our premium research. Click here to sign up with just your name and email address.
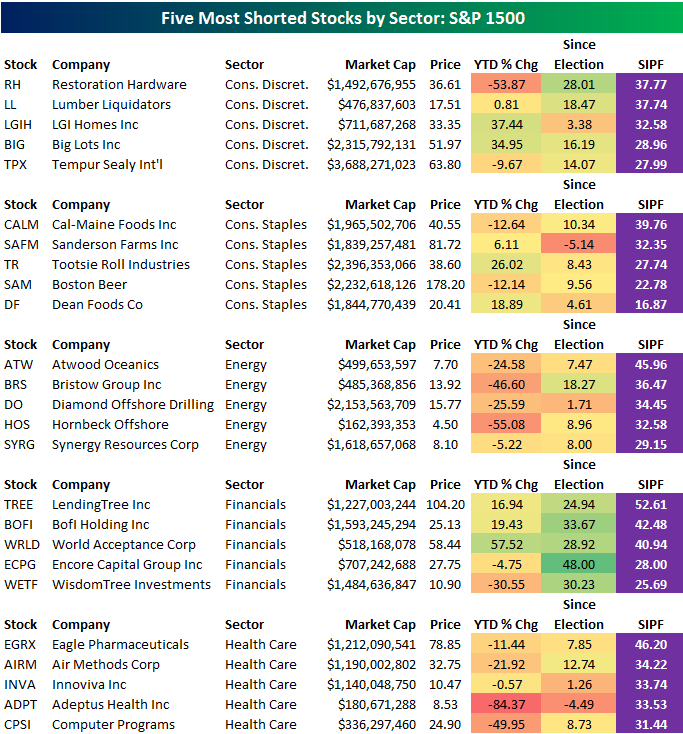
The 5 Most Shorted Stocks in Each Sector
Like our free content? You’ll like Bespoke Premium even more! Click here to start a 14-day free trial now.
In our prior post, we looked at average short interest levels by sector. Below we highlight the five most heavily shorted stocks in each sector of the S&P 1500. Remember, the S&P 1500 is made up of the large-cap S&P 500, the mid-cap S&P 400, and the small-cap S&P 600. That means it’s made up of stocks of all sizes. As you’ll see in the table below, though, there aren’t a lot of stocks with extremely high short interest levels that are larger than a few billion dollars in market cap.
For each stock, we show its market cap, year-to-date % change, % change since the election, and short interest as a percentage of float (SIPF).
Remember, if a stock has high short interest, it usually means a lot of investors think it’s going to go down. That doesn’t necessarily mean the stock is bound to go down, of course. And when a heavily shorted stock experiences good news, it generally results in bigger gains because it forces shorts to cover, which adds another layer of bids to the trade.
Within the Consumer Discretionary sector, Restoration Hardware (RH) and Lumber Liquidators (LL) are essentially tied with the highest short interest at 37.7%. Cal-Maine Foods (CALM) is the most heavily shorted Consumer Staples stock, and it’s interesting that Tootsie Roll (TR) and Boston Beer (SAM) are on the list as well.
Atwood Oceanics (ATW) is the most heavily shorted Energy stock with 46% of its float sold short. LendingTree (TREE) is the most heavily shorted Financial with a SIPF reading of 52.61%. That actually makes TREE the most heavily shorted stock in the entire S&P 1500. Eagle Pharma (EGRX) is the most shorted Health Care stock, while GATX and Greenbrier (GBX) are on top in Industrials. LSB Industries (LXU) has the highest short interest in the Materials sector. Finally, within Technology, Stamps.com (STMP) has the highest short interest at 28.75%, followed by EBIX and then 3D Systems (DDD).
See our more detailed Short Interest Report with a Bespoke Premium membership. Click here to start a 14-day free Premium trial now.
The Most and Least Heavily Shorted Sectors of the Market
Like our free content? You’ll like Bespoke Premium even more! Click here to start a 14-day free trial now.
US equity markets have rallied significantly since the election on November 8th. While the large-cap, market-cap weighted S&P 500 is up roughly 3 percentage points, the average stock in the S&P 1500 — which contains large-caps, mid-caps, and small-caps — is up 10% since Trump’s victory.
Areas of the market with heavy short interest typically do well when the market is in rally mode, so we thought it was a good time to provide some updated short interest analysis. (Click here to see our list of the 5 most shorted stocks in each sector.)
The chart below highlights the average stock’s short interest as a percentage of float (SIPF) within each sector of the S&P 1500. As shown, the average stock in the broad index has 6.3% of its float sold short. By far the most heavily shorted sector remains Energy, where the average stock has 10.3% of its float sold short. In 2014 and 2015 as Energy stocks tanked, short interest levels trended higher and higher. But this year, Energy stocks have bounced back significantly, and the shorts have gotten crushed. If Energy shares continue higher, we’ll likely see this reading dip under 10% pretty soon.
The next most shorted sector is Consumer Discretionary, where the average stock has 9.4% of its float shorted. This is a sector that has seen a massive rally since the election, so the shorts in this sector have taken a beating. Health Care ranks third at 7.4%, followed by Telecom at 6.7%. Health Care didn’t always have high short interest, but it has been creeping up recently as the sector has declined.
In our view, the most notable sector in the chart is Technology. Technology is generally viewed as the most speculative sector of the market, but as shown below, the average stock in the sector has only 5% of its float sold short. That’s the third lowest SIPF level for any sector behind only Real Estate and Utilities. We think this shows that investors might be a little too complacent about Tech right now, especially given the run it has had over the last eight years. Should Tech start to run out of steam, there’s a lot of shares out there for bears to borrow right now!
See our more detailed Short Interest Report with a Bespoke Premium membership. Click here to start a 14-day free Premium trial now.
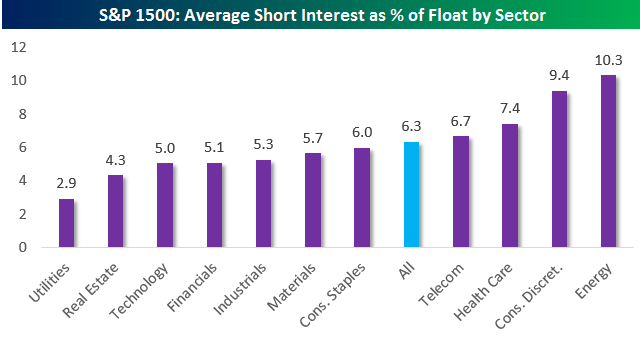
Chart of the Day: Making China Great Again?
B.I.G. Tips – Stock Prices and Rising Interest Rates
Bespoke Stock Scores: 11/29/16
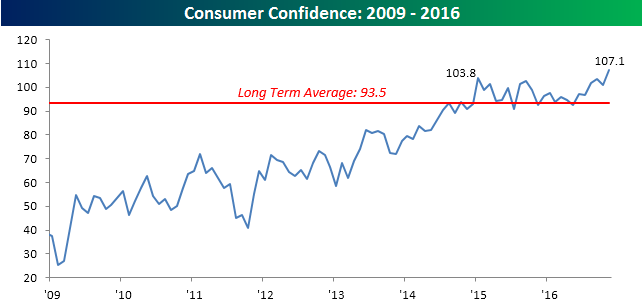
Yuuuuuge Increase in Consumer Confidence
Like our free content? You’ll like Bespoke Premium even more! Click here to start a 14-day free trial now.
Consumer Confidence for the month of November showed a large uptick as the headline index increased from an upwardly revised reading of 100.8 up to 107.1. It was also comfortably above consensus expectations for a reading of 101.5. As shown in the chart below, Consumer Confidence is not only well above its long-term average of 93.5, but it is also at a new cycle high (highest reading since July 2007).
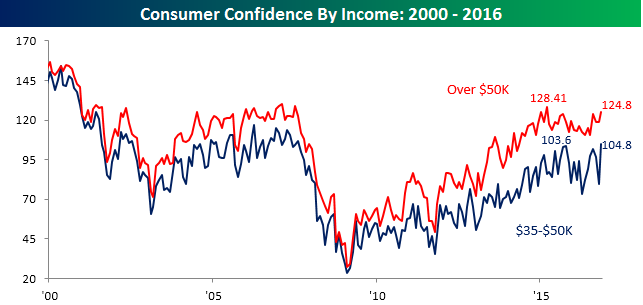
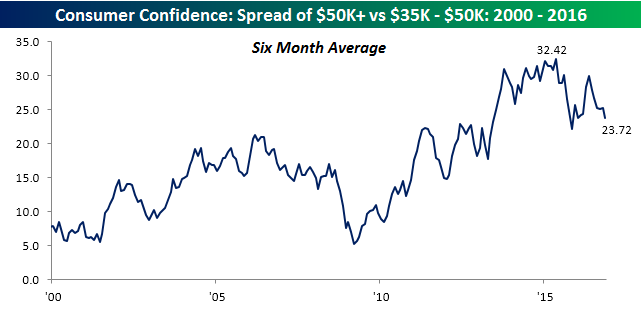
We have made numerous mentions over the years about how increases in Consumer Confidence during the current recovery have been driven disproportionately by higher-income consumers. Well, in the last several months that trend appears to be changing. The chart below shows Consumer Confidence grouped by consumers with incomes above $50K and those with incomes between $35K and $50K. As shown in the chart, as the recovery gained ground in 2009, the space between the red line (incomes above $50K) and blue line (incomes between $35K and $50K) steadily widened, but in early 2015, the pace of widening slowed, and has now actually started to shrink.
This is also illustrated by the fact that while confidence levels for both income groups increased in November, the increase was much larger for consumers with incomes between $35K and $50K compared to consumers with incomes of more than $50K. In fact, while confidence for consumers with incomes above $50K remains below its cycle high of 128.4 from March 2015, the index for consumers with incomes between $35K and $50K actually surged to a new cycle high. While critics of Trump have suggested that his tax policies would have a much greater impact on the rich, it is middle to lower end consumers that have seen the biggest boost to sentiment following his election.
On a final note, while the stock market surged in the days leading up to and after the election, and individual investors are more bullish than they have been in several months, sentiment towards stock prices in this month’s report actually turned less optimistic. In fact, based on this month’s report, more consumers are actually expecting lower stock prices (33.0%) than higher stock prices (30.3%). Go figure.
