The Closer 11/30/16 – Tax Holiday, Consumption Cruises
Log-in here if you’re a member with access to the Closer.
Looking for deeper insight on global markets and economics? In tonight’s Closer sent to Bespoke Institutional clients, we review today’s personal income and spending report. We also present a list of stocks that could benefit from a potential corporate tax holiday.

The Closer is one of our most popular reports, and you can see it and everything else Bespoke publishes by starting a no-obligation 14-day free trial to our research!
Dollar and Oil Both Surge in November
Like our free content? You’ll like Bespoke Premium even more! Click here to start a no-obligation 14-day free trial now.
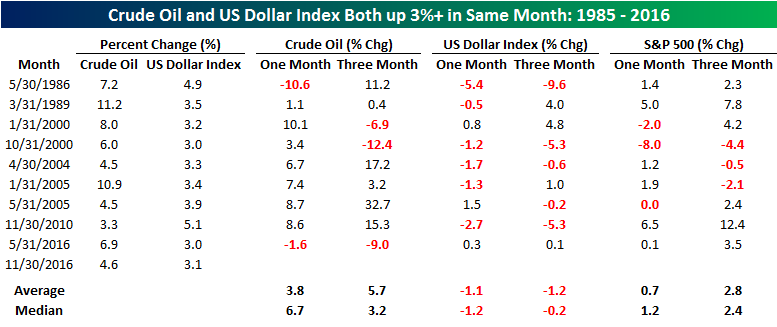
Here’s something you don’t see very often. During the month of November, not only did crude oil rally (thanks to today’s surge) gaining 4.6%, but the dollar also rallied more than 3%. To see both rally more than 3% in the same month is definitely not very common as there have only been nine prior occurrences in the last 30 years. What makes this move even crazier is that it is the second month this year that it has happened.
As shown in the table below, back in May, crude oil rallied even more (6.9%) as the US Dollar index also rallied 3%. Before that, you have to go back to November 2010 to find another occurrence. Looking at the other occurrences, there were also two occurrences in 2005 and two in 2000. For each occurrence in the table, we have also included performance figures for crude oil, the US Dollar Index, and the S&P 500 over the following one and three months. More often than not, the US Dollar index has given back some of these gains in the next one and three months with average returns of 1.1% and 1.2%, respectively. For crude oil and the S&P 500, though, the opposite has been the case as both have tended to trade higher in the next one and three months. In the case of crude oil, the commodity has averaged a gain of 3.8% over the following month and 5.7% over the next month. Meanwhile, equities have seen gains over the following one and three months two-thirds of the time with average gains of 0.7% and 2.8%, respectively.
The 5 Best Stocks in Each Sector Since the Election
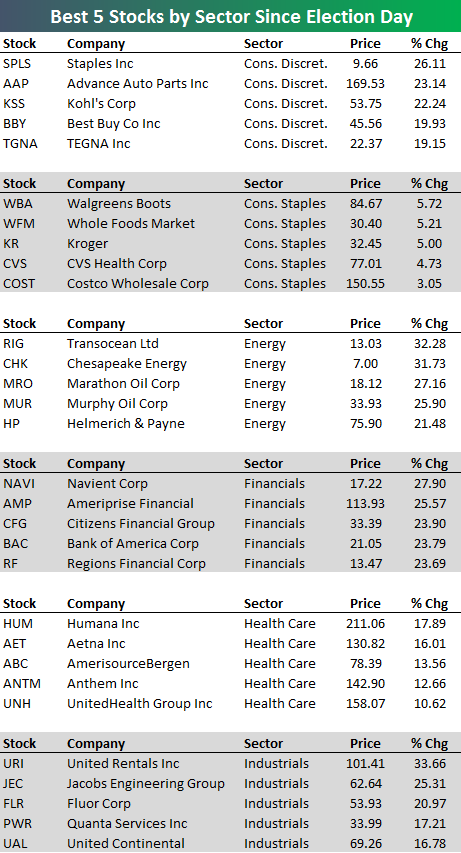
The average stock in the S&P 500 has gained 4.43% since Trump won the election on November 8th. Below we highlight the five best performing stocks in each S&P 500 sector since the close on Election Day. Obviously, the top five stocks in some sectors are up a lot more than the top five stocks in others. It’s a function of sector performance since the election, where we’ve seen areas like Financials, Consumer Discretionary, Industrials, and Energy do extremely well, while areas like Consumer Staples and Utilities have done poorly. In fact, three of the five best performing Utilities stocks since the election are actually in the red.
As shown, Staples (SPLS), Advance Auto Parts (AAP), and Kohl’s (KSS) have been the best Consumer Discretionary stocks with gains of 22%+. In Consumer Staples, however, Walgreens (WBA), Whole Foods (WFM), and Kroger (KR) have been the best with gains of just over 5%. Transocean (RIG) has been the top Energy stock with a gain of 32%, while Navient (NAVI), Ameriprise (AMP), and Citizens Financial (CFG) have been the top Financial stocks with gains of more than 23%. In Health Care, Humana (HUM) is up the most at 17.9%, and in Industrials, it’s United Rentals (URI) that holds the top spot with a gain of 33.7%.
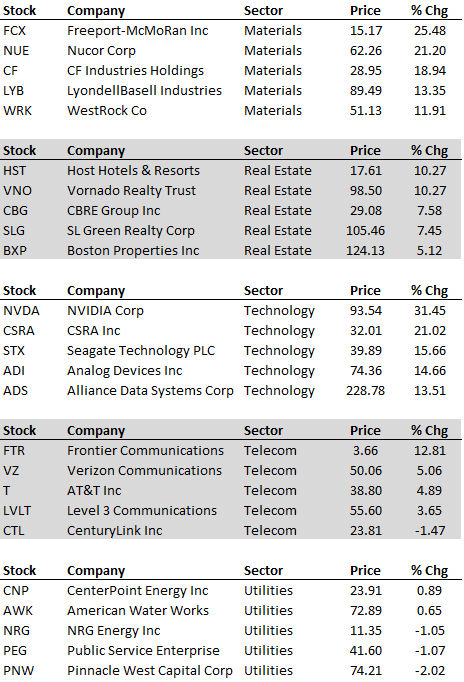
Freeport (FCX) and Nucor (NUE) have been the best performing Materials stocks since the election, while in the REIT space, Host Hotels (HST) and Vornado (VNO) are up the most at 10.27%. In Technology, NVIDIA (NVDA) is up by far the most with a gain of 31%, and in Telecom, the best stock has been Frontier (FTR). Finally, CenterPoint Energy (CNP) has been the top performing stock in the Utilities sector since the election with a gain of…wait for it…0.89%.
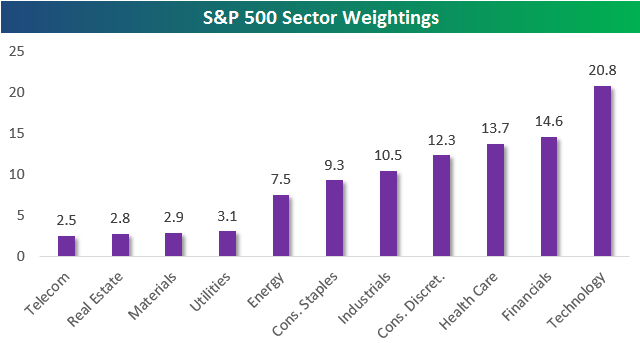
S&P 500 Sector Weightings — Post-Election Update
Below is an updated look at sector weightings in the S&P 500. As shown, Technology remains the largest sector in the index at 20.8%, while the Financial sector has moved back into second at 14.6%. Health Care ranks third at 13.7%, followed by Consumer Discretionary (12.3%), Industrials (10.5%), and Consumer Staples (9.3%). Energy ranks seventh at 7.5%, and the final four sectors (Utilities, Materials, Real Estate, Telecom) all have weightings between 2.5% and 3.1%.
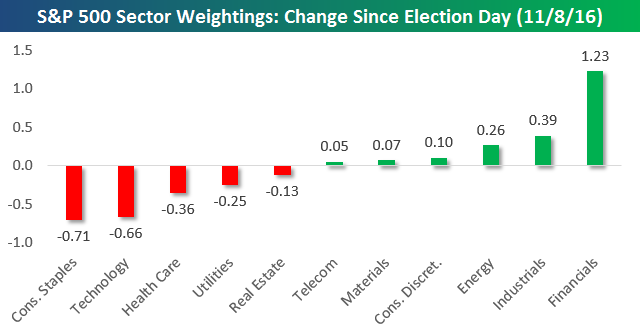
What’s most interesting about sector weightings is their changes over time. We post on this topic from time to time, but today we just want to show how weightings have changed since Trump was elected President on November 8th. As shown, the Financial sector has seen its weighting in the S&P 500 surge by 1.23 percentage points. The Industrials sector has seen the next biggest jump at 0.39 percentage points, followed by Energy (0.26) and Consumer Discretionary (0.10).
On the downside, Real Estate, Utilities, Health Care, Technology, and Consumer Staples have all lost market share since the election, with Consumer Staples losing the most at 0.71 percentage points. Due to its “growthy” nature, we’re wondering if Technology will be able to hold above 20% for much longer.
B.I.G. Tips — The Value Trade
“Value” Surges Past “Growth” Post Election
Like our free content? You’ll like Bespoke Premium even more! Click here to start a no-obligation 14-day free trial now.
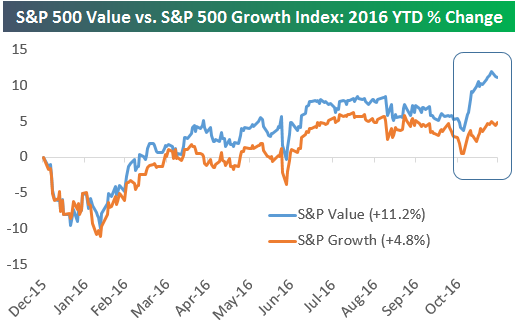
Much has been discussed about sector rotation into areas like Financials and Industrials since the election, but it’s also been a rotation from growth into value. Below is a chart that highlights this. It shows the year-to-date performance of the S&P 500 Growth index versus the S&P 500 Value index. While Value had been outperforming Growth slightly all year, it has been crushing it since the election (the boxed area in the chart). Heading into December, the Value index is up 11.2% year-to-date and 4.6% since the election versus a YTD gain of just 4.8% and 1.5% since the election for the Growth index.
Fixed Income Weekly – 11/30/16
Searching for ways to better understand the fixed income space or looking for actionable ideals in this asset class? Bespoke’s Fixed Income Weekly provides an update on rates and credit every Wednesday. We start off with a fresh piece of analysis driven by what’s in the headlines or driving the market in a given week. We then provide charts of how US Treasury futures and rates are trading, before moving on to a summary of recent fixed income ETF performance, short-term interest rates including money market funds, and a trade idea. We summarize changes and recent developments for a variety of yield curves (UST, bund, Eurodollar, US breakeven inflation and Bespoke’s Global Yield Curve) before finishing with a review of recent UST yield curve changes, spread changes for major credit products and international bonds, and 1 year return profiles for a cross section of the fixed income world.
In this week’s note, we update our tracking of the basis swap market.
Our Fixed Income Weekly helps investors stay on top of fixed income markets and gain new perspective on the developments in interest rates. You can sign up for a Bespoke research trial below to see this week’s report and everything else Bespoke publishes free for the next two weeks!
Click here to start your no-obligation free Bespoke research trial now!
B.I.G. Tips – December 2016 Seasonality
Sector Performance in November: Best and Worst Months Since…
Like our free content? You’ll like Bespoke Premium even more! Click here to start a 14-day free trial now.
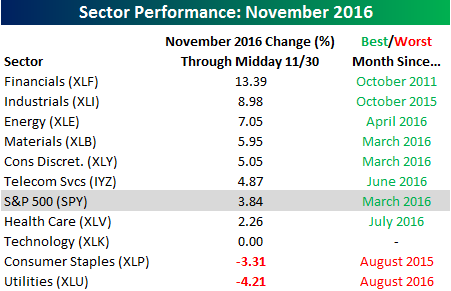
With just a couple of hours to go in the trading day, it has been a very good month for the market overall as well as most sectors. Not all sectors have had great months, though. The table below shows performance so far in November for the S&P 500 and all ten sectors as well as how this month stacks up versus other months for both the sectors that are up and down. The real star of the show this month has been Financials which have surged 13.39% for the sector’s best monthly return since October 2011! Behind Financials, Industrials rallied 8.98%, which was that sector’s best month since October 2015. On the downside, Utilities have been the S&P 500’s worst performing sector this month, falling 4.21%, which is that sector’s worst month since August. The only other sector currently in the red for the month is Consumer Staples (-3.21%). Given its typically stable nature, you have to go back more than two years to find a month where the sector performed worse than this month. Finally, for all the sector rotation that took place this month, it’s hard to believe that Technology is unchanged this month!
While it seems as though the market has done nothing but go up this month, it was pretty surprising to see that the S&P 500 was actually up more in a month as recently as March and for all but two sectors, November has not been the best month of 2016.