The Closer 12/22/16 – ‘Twas The Data Dump Before Christmas
Log-in here if you’re a member with access to the Closer.
Looking for deeper insight on global markets and economics? In tonight’s Closer sent to Bespoke Institutional clients, we break down a huge slug of economic data released just before the holidays. Final Q3 GDP, November preliminary durable goods, state leading indicators, November personal income and spending, and the PCE inflation data from the personal income and spending report.

The Closer is one of our most popular reports, and you can see it and everything else Bespoke publishes by starting a no-obligation 14-day free trial to our research!
ETF Trends: US Indices & Styles – 12/22/16
MLPs continue to outperform, along with Telecoms Energy names. The Swedish krona is up almost 2% versus the USD over the past week, a surprise entrant in the best performers list. Gold miners have also bounced over teh last week along with preferred shares and bonds. Asian country ETFs have underperformed badly, dominating the list of biggest decliners over the past week.

Bespoke provides Bespoke Premium and Bespoke Institutional members with a daily ETF Trends report that highlights proprietary trend and timing scores for more than 200 widely followed ETFs across all asset classes. If you’re an ETF investor, this daily report is perfect. Sign up below to access today’s ETF Trends report.
See Bespoke’s full daily ETF Trends report by starting a no-obligation free trial to our premium research. Click here to sign up with just your name and email address.
Bespoke’s Sector Snapshot — 12/22/16
We’ve just released our weekly Sector Snapshot report (see a sample here) for Bespoke Premium and Bespoke Institutional members. Please log-in here to view the report if you’re already a member. If you’re not yet a subscriber and would like to see the report, please start a 14-day trial to Bespoke Premium now.
Below is one of the many charts included in this week’s Sector Snapshot, which is our trading range screen for the S&P 500 and its ten sectors. We discuss in more detail how to read the chart in the full version of the report, but basically the dot is where the sector is currently trading, while the tail end is where it was trading one week ago. Last week at this time, all S&P 500 sectors were above their 50-day moving averages. Unfortunately, Health Care has ruined the party.
To see our full Sector Snapshot with additional commentary plus six pages of charts that include analysis of valuations, breadth, technicals, and relative strength, start a 14-day free trial to our Bespoke Premium package now. Here’s a breakdown of the products you’ll receive.
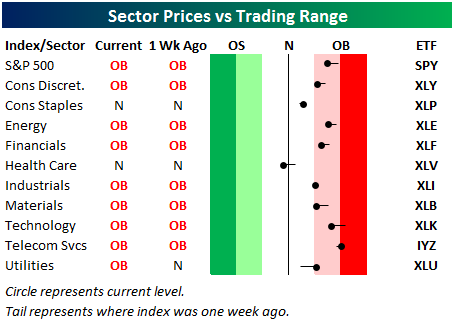
Chart of the Day: Leading vs Coincident Indicator Ratio Drifts Lower
Dynamic Upgrades/Downgrades: 12/22/16
Jobless Claims “Spike” to a Six Month High
Get Bespoke’s 2017 Outlook Report with a 30-day free trial to Bespoke’s premium research! Click here to learn more.
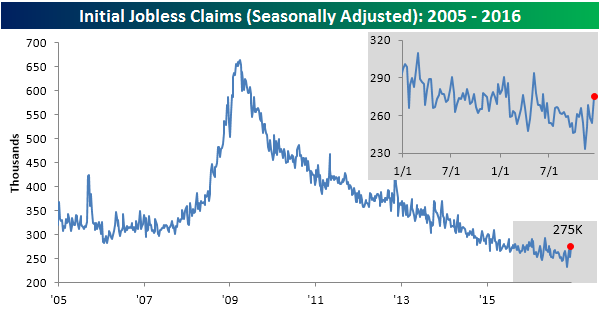
Jobless claims came in higher than expected this week rising from 254K up to 275K, which is the highest weekly reading since early June and well above the 257K consensus forecast. It was also tied for the second largest weekly increase in claims since February. It’s hard to get too worked up about a jobless claims print at 275K, which is low by historical standards, but anytime you see a sizable increase, you have to be on the lookout for any signs that the overall trend is shifting. As it stands now, claims have been under 300K for 94 straight weeks, but if they start to approach or top that 300K threshold, it may cause some uneasiness.
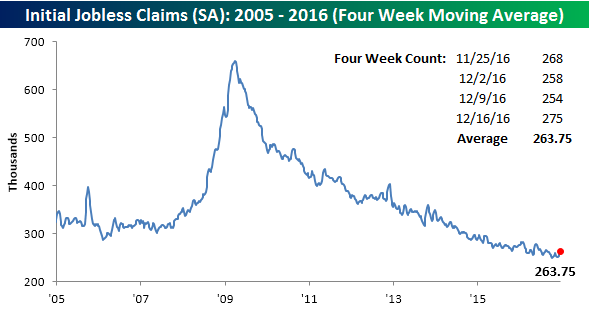
The four-week moving average for jobless claims now stands at 263.75K, which is 14.25K above the post-recession low of 249.5K reached eleven weeks ago back in early October. As weekly claims start to trend higher, that sub-250K four-week moving average is looking likelier and likelier to stand for some time.
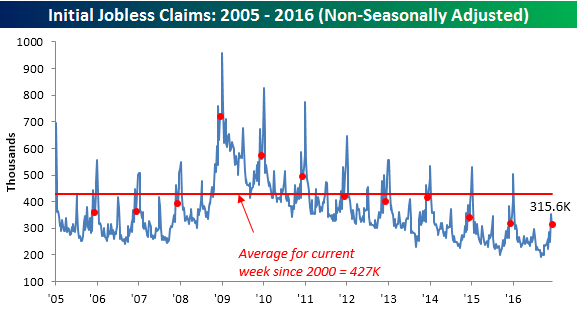
On a non-seasonally adjusted (NSA) basis, claims increased to 315.6K from 305.3K. For this time of year, though, this week’s NSA print was more than 110K below the average for the current week going back to 2000 and the lowest for the current week of the year since 1969!
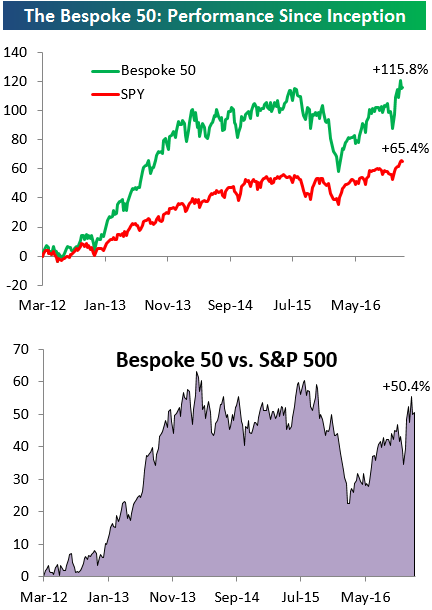
the Bespoke 50 — 12/22/16
Every Thursday, Bespoke publishes its “Bespoke 50” list of top growth stocks in the Russell 3,000. Our “Bespoke 50” portfolio is made up of the 50 stocks that fit a proprietary growth screen that we created a number of years ago. Since inception in early 2012, the “Bespoke 50” has nearly doubled the performance of the S&P 500. Through today, the “Bespoke 50” is up 115.8% since inception versus the S&P 500’s gain of 65.4%.
To view our “Bespoke 50” list of top growth stocks, sign up for Bespoke Premium ($99/month) at this checkout page and get your first month free. This is a great deal!
Bulls Under 50% For 103rd Straight Week
Get Bespoke’s 2017 Outlook Report with a 30-day free trial to Bespoke’s premium research! Click here to learn more.
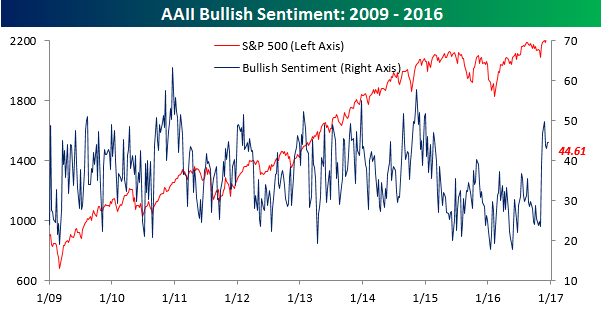
Given the upcoming holiday weekend and individual investors focusing their attention on other things, it is little surprise that sentiment was little changed in the latest week. According to the weekly survey from AAII, bullish sentiment declined from 44.66% down to 44.61%. At 0.05%, you can’t get much of a smaller decline than that. While the move was insignificant, the level certainly was, as it represents the 103rd straight week where bulls have not been in the majority.
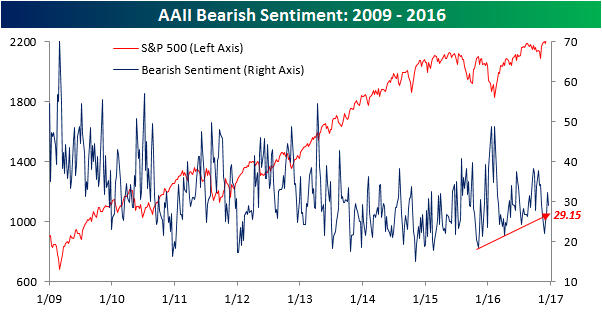
While bullish sentiment was little changed, bearish sentiment saw a relatively larger move. In this week’s survey, the percentage of pessimists dropped from 32.33% down to 29.15%.
Bespokecast Episode 4 — Joe Weisenthal — Now Available on iTunes, GooglePlay, Stitcher and More
 We’re happy to announce that the newest episode of Bespokecast is now available to the general public both here and via the various podcast platforms. Be sure to subscribe to Bespokecast on your preferred podcast app of choice to gain access to our full collection of episodes. We’d also love for you to provide a review as well!
In our newest conversation on Bespokecast, we speak with Bloomberg Markets Managing Editor Joe Weisenthal. Joe is a living clearinghouse for information and news on financial markets, with a huge presence on Twitter, the Odd Lots podcast co-hosted with Tracy Alloway, and a daily show on Bloomberg TV (What Did You Miss?). He’s been on the forefront of financial media since the mid-2000s, starting TheStalwart.com before joining Business Insider early in that company’s ascent in the digital media space. Joe has a fascinating perspective on markets and the media that cover them. In our hour-long conversation, we cover a range of topics, including his career path, how he thinks about the modern media landscape, the disconnect between accepted wisdom and actual events this year, and how becoming a father has impacted his career. We had a lot of fun recording this conversation and we hope you enjoy it!
Each new episode of our podcast will feature a special guest to talk markets with, and Bespoke subscribers receive special access before it’s made available to the general public. If you’d like to try out a Bespoke subscription in order to gain access to these podcasts in advance, you can start a two-week free trial to check out our product. To listen to episode 4 or subscribe to the podcast via iTunes, GooglePlay, OvercastFM, or Stitcher, please click below.

The Closer 12/21/16 – Snoozing Ahead Of Saint Nick
Log-in here if you’re a member with access to the Closer.
Looking for deeper insight on global markets and economics? In tonight’s Closer sent to Bespoke Institutional clients, we take a look at the extremely tight range on the S&P 500 today, the impact of higher rates on home prices, and today’s existing home sales report.
The Closer is one of our most popular reports, and you can see it and everything else Bespoke publishes by starting a no-obligation 14-day free trial to our research!