World of Pain for NVIDIA (NVDA) Shorts
Get Bespoke’s 2017 Outlook Report with a 30-day free trial to Bespoke’s premium research! Click here to learn more.
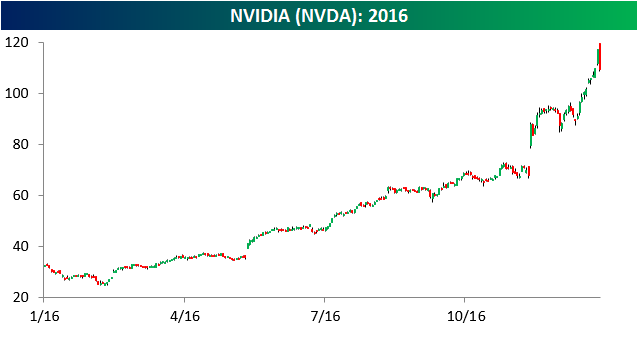
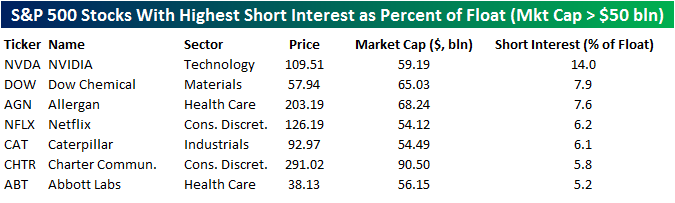
With the stock entering today on a ten-day winning streak following what has already been a remarkable year for shares, you have no doubt heard of the NVIDIA (NVDA) story in 2016. The stock is up over 200% this year, making it far and away the best-performing stock in the S&P 500 and one of only two stocks in the index that have doubled in 2016. What you probably haven’t heard, though, is just how many traders have been betting against the stock along the way. You see, short interest as a percentage of float for NVDA currently stands at 14%, which is an extremely high reading for a large cap stock. Of the stocks in the S&P 500 with market caps of $50 billion or more, NVDA’s short interest is the highest of any, and the short interest levels of the next closest stock (DOW – 7.9%) isn’t much more than half NVDA’s. So while there have surely been a lot of investors that have ridden NVDA higher, there are more than a few losers as well.
The Bespoke Report — 2017 — “Yield Curve/Fed”
 Our 2017 Bespoke Report market outlook is the most important piece of research that Bespoke publishes each year. We’ve been publishing our annual outlook piece since the formation of Bespoke in 2007, and it gets better and better each year! In this year’s edition, we’ll be covering every important topic you can think of dealing with financial markets as we enter 2017. And to say that 2017 should be an interesting year for asset classes would be an understatement given the huge rotation we’ve already seen in just a few weeks since the Presidential Election was held back on November 8th.
The 2017 Bespoke Report contains sections like Washington and Markets, Economic Cycles, Market Cycles, Washington, Sector Technicals and Weightings, Stock Market Sentiment, Stock Market Seasonality, Housing, Commodities, and more. In this year’s edition, we’ll also be featuring our new “Trump Index” of stocks that we expect to perform best in 2017 based on the new administration.
Over the next week until the full publication is sent to paid members on December 29th, we’ll be releasing individual sections as we complete them. Today we have published the “Yield Curve/Fed” section of the 2017 Bespoke Report, which lays out our views on the path for interest rates in 2017.
To view this section immediately and also receive the full 2017 Bespoke Report when it’s published on December 29th, simply sign up for a 30-day free trial to Bespoke Premium. It’s that easy!
The Bespoke Report — 2017 — “Prognostications”
Our 2017 Bespoke Report market outlook is the most important piece of research that Bespoke publishes each year. We’ve been publishing our annual outlook piece since the formation of Bespoke in 2007, and it gets better and better each year! In this year’s edition, we’ll be covering every important topic you can think of dealing with financial markets as we enter 2017. And to say that 2017 should be an interesting year for asset classes would be an understatement given the huge rotation we’ve already seen in just a few weeks since the Presidential Election was held back on November 8th.
The 2017 Bespoke Report contains sections like Washington and Markets, Economic Cycles, Market Cycles, Washington, Sector Technicals and Weightings, Stock Market Sentiment, Stock Market Seasonality, Housing, Commodities, and more. In this year’s edition, we’ll also be featuring our new “Trump Index” of stocks that we expect to perform best in 2017 based on the new administration.
Over the next week until the full publication is sent to paid members on December 29th, we’ll be releasing individual sections as we complete them. Today we have published the “Prognostications” section of the 2017 Bespoke Report, which looks at consensus expectations from strategists and economists for things like the S&P 500, earnings, GDP, CPI, unemployment, interest rates, and the euro.
To view this section immediately and also receive the full 2017 Bespoke Report when it’s published on December 29th, simply sign up for a 30-day free trial to Bespoke Premium. It’s that easy!
Chart of the Day: Sector Ranks and Next-Year Performance
ETF Trends: US Sectors & Groups – 12/28/16
Over the past week, commodities plays of various types have done best with natural gas, Brazil, gold miners, and MLPs posting the largest returns over the last five sessions. Coffee, solar stocks, and retail have suffered the most. The dollar has been strong, but FXS (Swedish krona) is one of the biggest gaining funds in the past week. Asian regional equities have underperformed with EM and DM Asia trailing US equities.

Bespoke provides Bespoke Premium and Bespoke Institutional members with a daily ETF Trends report that highlights proprietary trend and timing scores for more than 200 widely followed ETFs across all asset classes. If you’re an ETF investor, this daily report is perfect. Sign up below to access today’s ETF Trends report.
See Bespoke’s full daily ETF Trends report by starting a no-obligation free trial to our premium research. Click here to sign up with just your name and email address.
The Closer 12/27/16 – Consumers And Businesses Confident
Log-in here if you’re a member with access to the Closer.
Looking for deeper insight on global markets and economics? In tonight’s Closer sent to Bespoke Institutional clients, we take a look at optimism breaking out among consumers and businesses alike, We also chart out national home prices which finished up just short of a new all-time high in October.

The Closer is one of our most popular reports, and you can see it and everything else Bespoke publishes by starting a no-obligation 14-day free trial to our research!
Bespoke Stock Scores: 12/27/16
ETF Trends: Hedge – 12/27/16
Natural gas and gold miners have led the way over the past week. with Brazil and other Latin American ETFs also performing well. MLPs have been reasonably solid over the past week. Coffee, solar, and southeast Asia have all been weak, with REITs the worst performing US equity sector over the holiday week.
Bespoke provides Bespoke Premium and Bespoke Institutional members with a daily ETF Trends report that highlights proprietary trend and timing scores for more than 200 widely followed ETFs across all asset classes. If you’re an ETF investor, this daily report is perfect. Sign up below to access today’s ETF Trends report.
See Bespoke’s full daily ETF Trends report by starting a no-obligation free trial to our premium research. Click here to sign up with just your name and email address.
The Bespoke Report — 2017 — “Sector Weightings and Technicals”
Our 2017 Bespoke Report market outlook is the most important piece of research that Bespoke publishes each year. We’ve been publishing our annual outlook piece since the formation of Bespoke in 2007, and it gets better and better each year! In this year’s edition, we’ll be covering every important topic you can think of dealing with financial markets as we enter 2017. And to say that 2017 should be an interesting year for asset classes would be an understatement given the huge rotation we’ve already seen in just a few weeks since the Presidential Election was held back on November 8th.
The 2017 Bespoke Report contains sections like Washington and Markets, Economic Cycles, Market Cycles, Washington, Sector Technicals and Weightings, Stock Market Sentiment, Stock Market Seasonality, Housing, Commodities, and more. In this year’s edition, we’ll also be featuring our new “Trump Index” of stocks that we expect to perform best in 2017 based on the new administration.
Over the next week until the full publication is sent to paid members on December 29th, we’ll be releasing individual sections as we complete them. Today we have published the “Sector Weightings and Technicals” section of the 2017 Bespoke Report, which provides our technical take on the long-term chart patterns of the major S&P 500 sectors.
To view this section immediately and also receive the full 2017 Bespoke Report when it’s published on December 29th, simply sign up for a 30-day free trial to Bespoke Premium. It’s that easy!
The Bespoke Report — 2017 — “Housing”
Our 2017 Bespoke Report market outlook is the most important piece of research that Bespoke publishes each year. We’ve been publishing our annual outlook piece since the formation of Bespoke in 2007, and it gets better and better each year! In this year’s edition, we’ll be covering every important topic you can think of dealing with financial markets as we enter 2017. And to say that 2017 should be an interesting year for asset classes would be an understatement given the huge rotation we’ve already seen in just a few weeks since the Presidential Election was held back on November 8th.
The 2017 Bespoke Report contains sections like Washington and Markets, Economic Cycles, Market Cycles, Washington, Sector Technicals and Weightings, Stock Market Sentiment, Stock Market Seasonality, Housing, Commodities, and more. In this year’s edition, we’ll also be featuring our new “Trump Index” of stocks that we expect to perform best in 2017 based on the new administration.
Over the next week until the full publication is sent to paid members on December 29th, we’ll be releasing individual sections as we complete them. Today we have published the “Housing” section of the 2017 Bespoke Report, which provides our view on housing heading into the new year.
To view this section immediately and also receive the full 2017 Bespoke Report when it’s published on December 29th, simply sign up for a 30-day free trial to Bespoke Premium. It’s that easy!