The Bespoke Report — 1/20/17
If you’re not yet a Bespoke subscriber, you can still get Bespoke’s 2017 Outlook Report with a 30-day free trial to Bespoke’s premium research! Click here to learn more.
Eight years ago today, the presidency of what many called the most anti-business and anti-market candidate ever elected to the country’s highest office began. At the time of President Obama’s inauguration, for many, today couldn’t come soon enough. The consensus was that once his four years in office were done (because how could he ever be elected to a second term), the overall sentiment would be “good riddance.” As the saying goes, though, that’s why the play the game, because even when you think you have it all figured out, the outcome often looks different than what many expect.
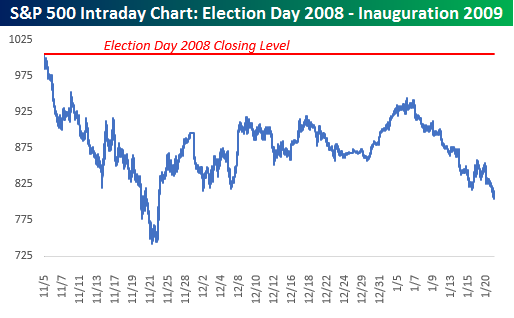 Right out of the gate after the 2008 election, stocks reacted negatively. On the day after Obama’s election in 2008, the S&P 500 declined over 5%, and it kept going down from there. At the intraday low in November, the S&P 500 lost more than a quarter of its value, in what was one of the steepest sell-offs in reaction to a Presidential election in market history. The market recovered a bit from there, but remained extremely volatile throughout the transition, but at the end of the day on his inauguration, the S&P 500 was still down 20% since he was elected. We would be remiss not to mention the fact that the US economy was in the middle of a Financial Crisis during this period so that was a big contributor to the market weakness, but the general perception from the markets was still that Obama would be bad for stocks.
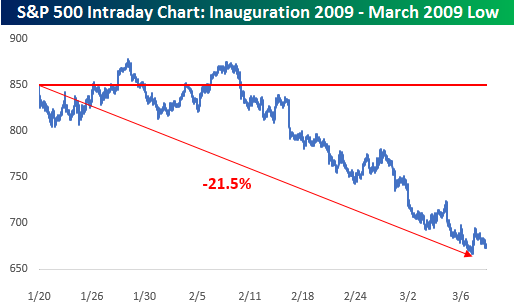 If Obama was hoping for a honeymoon once he came into office, he didn’t get it. While the first couple of weeks of his Presidency saw sideways trading, the bottom fell out of the market again in early February, falling over 21% through early March. At this point, investors were wondering how many bottoms there were to fall out of, while President Obama was probably watching the headlines pile up and wondering what he had gotten himself into!
If you’d like to see the rest of this week’s Bespoke Report newsletter, take advantage of our one-month Bespoke Premium free trial offer that includes our 2017 Outlook Report. Sign up now at this page.
Have a great weekend!
Quick View Chart Book — 1/21/17
ETF Trends: Fixed Income, Currencies, and Commodities – 1/20/17
Scandinavian indices were some of the best performers of the past week, with Semis, Consumer Staples, and Gold Miners outperforming in the US. Pound sterling has rallied over the last week, along with stronger gold prices and rallies in Mexico and Germany, in part because of a big USDMXN decline (stronger peso) today. Natural gas, Russia, Indonesia, and high duration Treasuries are the worst performers over the last five days though Biotech, Pharma, and Banks also lagged.

Bespoke provides Bespoke Premium and Bespoke Institutional members with a daily ETF Trends report that highlights proprietary trend and timing scores for more than 200 widely followed ETFs across all asset classes. If you’re an ETF investor, this daily report is perfect. Sign up below to access today’s ETF Trends report.
See Bespoke’s full daily ETF Trends report by starting a no-obligation free trial to our premium research. Click here to sign up with just your name and email address.
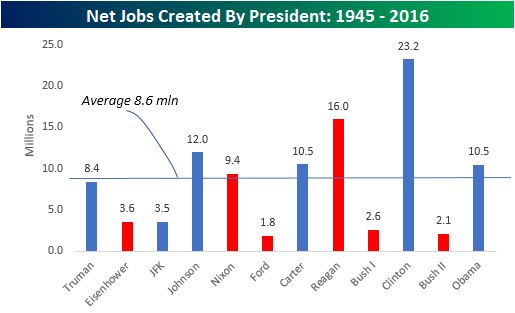
Job Creation By President
One of the first promises President Trump made when he announced his candidacy over a year ago was that he would be the “the greatest jobs President God ever created.” So, just how many jobs is that? Payrolls data only goes back as far as 1939, so data that spans an entire President’s tenure only goes back as far as Truman. With that data, though, the chart below shows the net number of jobs created for every US President since Truman. As shown in the chart, the current title of “the greatest jobs President God ever created” belongs to Bill Clinton who presided over an eight year period where 23.2 million jobs were created. Second on the list is Reagan at 16.0 million.
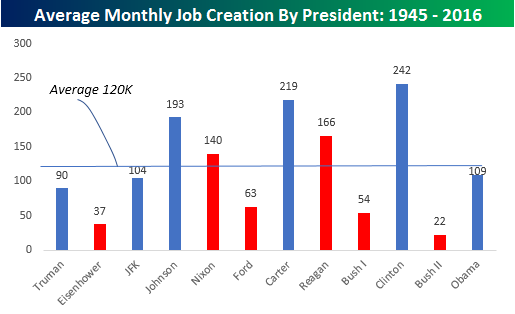
For various reasons, not all Presidents have the opportunity to serve two full terms in office. In the case of President Trump, he is entering office as the oldest elected President in US history, so while it’s unlikely, you never know if that will become a factor. In order to give each President an equal footing, the chart below shows average monthly job creation by President going back to Truman. Here again, Clinton tops the list at an average of 242K jobs per month. What may surprise some is that the President who saw the second highest average of monthly job creation was President Carter. Even though only 10.5 million jobs were created while he was in office (same as Obama), since those jobs were created in a window of just four years, average monthly job creation under his watch was 219K per month. Whichever way you want to look at it, Trump better get to work quickly.
The Closer 1/19/17 – Strong Starts, Weak Wages
Log-in here if you’re a member with access to the Closer.
Looking for deeper insight on global markets and economics? In tonight’s Closer sent to Bespoke Institutional clients, we break down monthly residential construction data, also updating our summary of Atlanta Fed Median wage tracking.

The Closer is one of our most popular reports, and you can see it and everything else Bespoke publishes by starting a no-obligation 14-day free trial to our research!
Sunset on the Obama Presidency
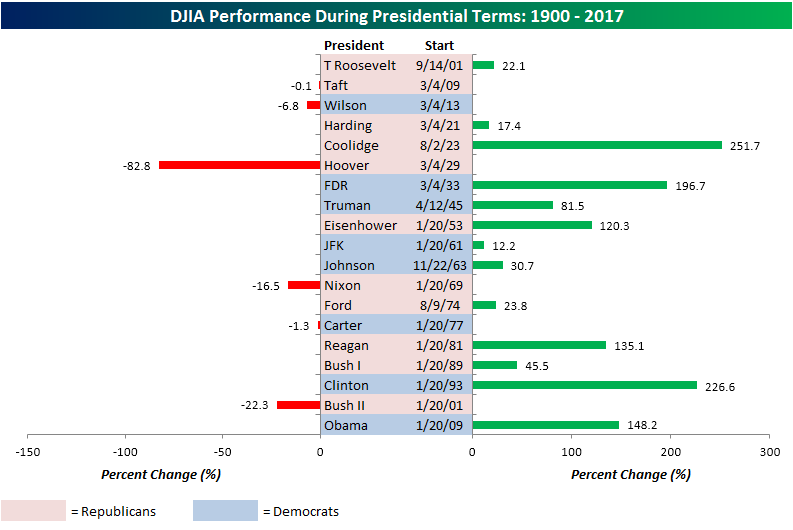
The sun is literally setting for the last time on the Presidency of Barack Obama, and despite what can only be characterized as the worst start for the stock market under a President’s term in office, equities rebounded early on in Obama’s tenure staging one of the longest and strongest bull markets in US history. Through Thursday, the DJIA is up over 148% (not including dividends) since the close on Inauguration Day 2009, and that ranks as the fourth best return for the DJIA under any President since 1900.
The title of best ‘stock market President God ever created’ belongs to Calvin Coolidge who presided over a gain of 251.7% during his time in office. Coolidge was followed by Clinton (227%), and FDR (197%). Outside of these four Presidents, the only others who saw triple-digit returns under their watch were Reagan (135%) and Eisenhower (120%). On the other side of the coin, Herbert Hoover presided over a decline of over 80% under his watch, while the second George Bush saw the DJIA fall 22% under his watch.
ETF Trends: International – 1/19/17
Turkey continues to bounce along with large swathes of emerging markets. An unlikely hero in US equities over the past week has been consumer staples where beaten down yield stocks have gotten a bit of relief. Big post-election winners (Banks, Russia, Microcaps, Value) have all been hit over the last few days despite moves higher in bond yields.
Bespoke provides Bespoke Premium and Bespoke Institutional members with a daily ETF Trends report that highlights proprietary trend and timing scores for more than 200 widely followed ETFs across all asset classes. If you’re an ETF investor, this daily report is perfect. Sign up below to access today’s ETF Trends report.
See Bespoke’s full daily ETF Trends report by starting a no-obligation free trial to our premium research. Click here to sign up with just your name and email address.
Chart of the Day: Market Response To The ECB
Inauguration Day Returns
When the DJIA first started flirting with 20,000 over a month ago, it seemed like a near certainty that the index would reach that milestone before Donald Trump’s inauguration on 1/20. On the eve of his swearing in, though, Dow 20K remains on the to-do list. If historical returns for equities on the day newly elected presidents have been inaugurated is any indication, it is looking like Dow 20K will have to be an item for the first 100 days rather than the transition.
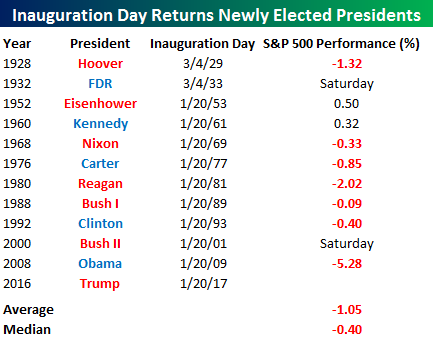
The table below lists the S&P 500’s one day return on the day that every newly elected President since 1928 has been inaugurated (Presidents who assumed office mid-term were not included). Of the eleven Presidents highlighted, nine were inaugurated on days where the market was open, and looking at the results, these haven’t been particularly good days. Overall, the S&P 500 has averaged a decline of 1.05% on these days with a median decline of 0.40%. The two worst Inauguration Days for the S&P 500 since 1928 were the days that Reagan (-2.02%) and Obama (-5.28%) were first sworn in. On the upside, the only two Presidents that got off to a positive start with their time in office were Eisenhower (+0.50%) and Kennedy (+0.32%), and in each case the gains were relatively modest. If the DJIA is going to get to 20K before the end of the week, bulls are going to have to make Inauguration Days great again.
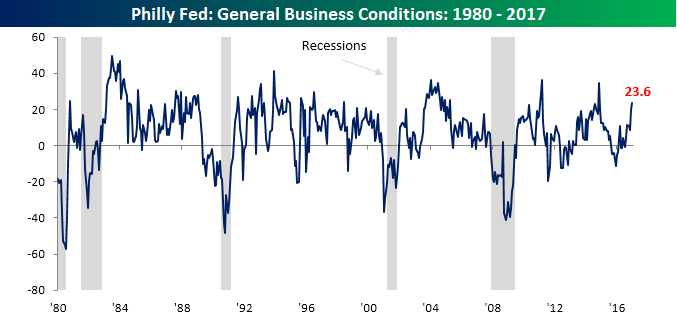
Philly Fed Breaks Out
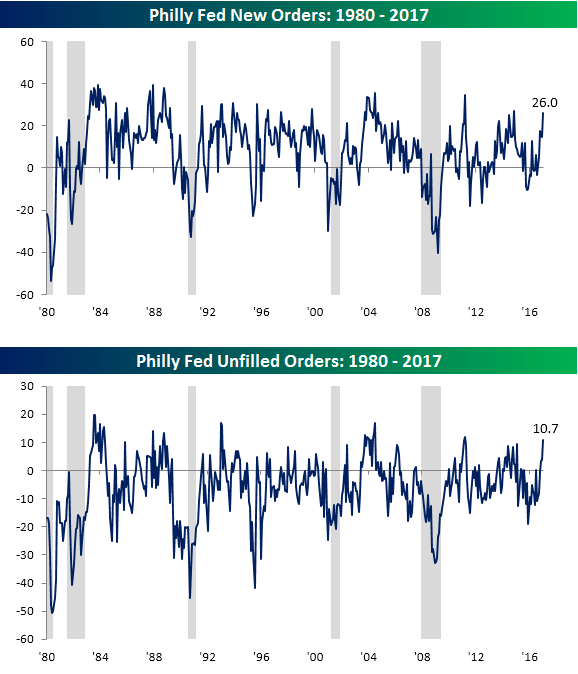
While manufacturing activity in the New York region was slightly weaker than expected earlier in the week, the Philly Fed manufacturing report handily exceeded forecasts. While economists were forecasting the headline reading to come in at a level of 15.3, the actual reading came in at 23.6, which was the highest level since November 2014.
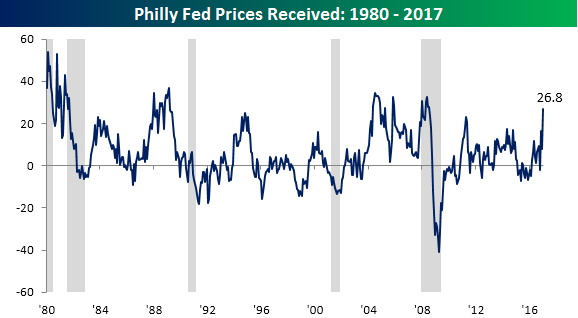
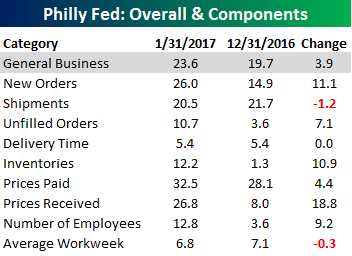 The internals of this month’s report were solid with just two of nine components declining, and the declines (Shipments and Average Workweek) were modest at that. On the upside, there were big gains in Prices Received (even as Prices Paid saw just a modest increase), New Orders, and Inventories. Below we have included the charts of New Orders, Unfilled Orders, and Prices Received. The index for New Orders is back up near its highs from November 2014, while Unfilled Orders was even stronger hitting its highest level since March 2011. The most standout chart, though, is Prices Received. As shown in the bottom chart, that component is now at its highest level since July 2008.