Bespoke Bloomberg TV Appearance (1/27)
Bespoke co-founder Paul Hickey appeared on “Bloomberg Daybreak: Asia.” last night to discuss the US market outlook. To view the segment, please click on the image below.
The Closer 1/26/17 – All Charts On Deck!
Log-in here if you’re a member with access to the Closer.
Looking for deeper insight on global markets and economics? In tonight’s Closer sent to Bespoke Institutional clients, we take a look at a big range of US economic indicators: Bloomberg Consumer Comfort, the Leading/Coincident economic indicator ratio, new home sales, the Chicago Fed’s National Activity Index, crop exports and farm income, and truck tonnage.

The Closer is one of our most popular reports, and you can see it and everything else Bespoke publishes by starting a no-obligation 14-day free trial to our research!
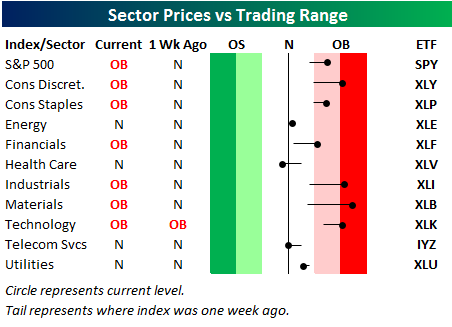
Bespoke’s Sector Snapshot — 1/26/17
We’ve just released our weekly Sector Snapshot report (see a sample here) for Bespoke Premium and Bespoke Institutional members. Please log-in here to view the report if you’re already a member. If you’re not yet a subscriber and would like to see the report, please start a 14-day trial to Bespoke Premium now.
Below is one of the many charts included in this week’s Sector Snapshot, which highlights our trading range screen for the S&P 500 and ten sectors. Last week at this time, all ten sectors were above their 50-day moving averages, but Health Care and Telecom have now pulled back below their 50-days. Materials is currently the most overbought of any sector.
To see our full Sector Snapshot with additional commentary plus six pages of charts that include analysis of valuations, breadth, technicals, and relative strength, start a 14-day free trial to our Bespoke Premium package now. Here’s a breakdown of the products you’ll receive.
Short Interest Report: 1/26/17
the Bespoke 50 — 1/26/17
Every Thursday, Bespoke publishes its “Bespoke 50” list of top growth stocks in the Russell 3,000. Our “Bespoke 50” portfolio is made up of the 50 stocks that fit a proprietary growth screen that we created a number of years ago. Since inception in early 2012, the “Bespoke 50” has nearly doubled the performance of the S&P 500. Through today, the “Bespoke 50” is up 115.6% since inception versus the S&P 500’s gain of 68.6%.
To view our “Bespoke 50” list of top growth stocks, sign up for Bespoke Premium ($99/month) at this checkout page and get your first month free. This is a great deal!
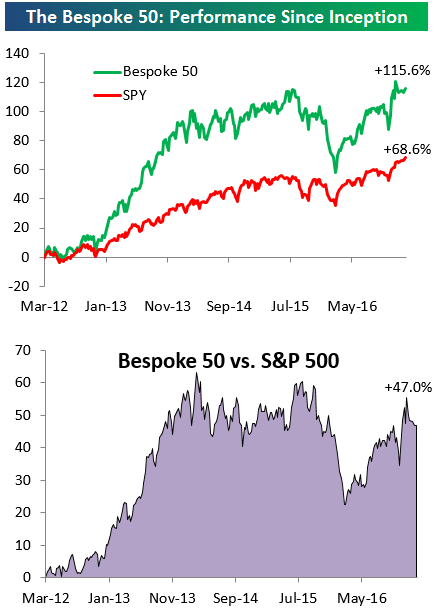
Chart of the Day: Alphabroken Out
ETF Trends: International – 1/26/17
While new home sales plunged today, homebuilders were the strongest group over the last five days as-of the time the snapshot below was taken…prior to a brutal new home sales print for the month of December. Mexico was also down big this morning on another Trump tweet but has gained big over the last week. Long bonds, gold, pharma, and biotech have been the worst performing sectors while the USD has declined notably in the past week.

Bespoke provides Bespoke Premium and Bespoke Institutional members with a daily ETF Trends report that highlights proprietary trend and timing scores for more than 200 widely followed ETFs across all asset classes. If you’re an ETF investor, this daily report is perfect. Sign up below to access today’s ETF Trends report.
See Bespoke’s full daily ETF Trends report by starting a no-obligation free trial to our premium research. Click here to sign up with just your name and email address.
Snap Out of It! Individual Investors Still Not Feeling the Love
Want to see more analysis like this? Click here to start a no-obligation two-week free trial.
Whether you want to call it skepticism, self-control, or downright stubbornness, the fact that bullish sentiment has been so restrained even as US equities continue to trade to record highs is amazing. In this week’s survey from AAII, bullish sentiment on the part of individual investors dropped from 37.01% down to 31.58%, marking the second straight week where bullish sentiment has declined by five percentage points or more. That hasn’t happened since May. This week’s survey also marked the 108th straight week where bullish sentiment was below 50%.
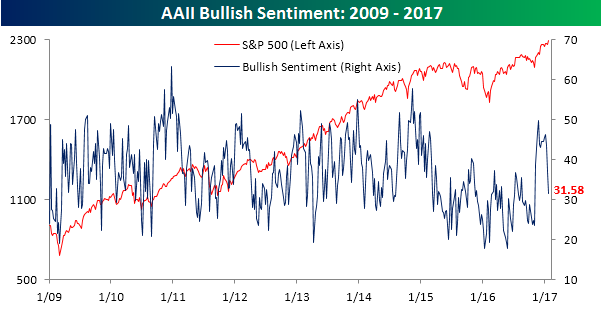 ,
,
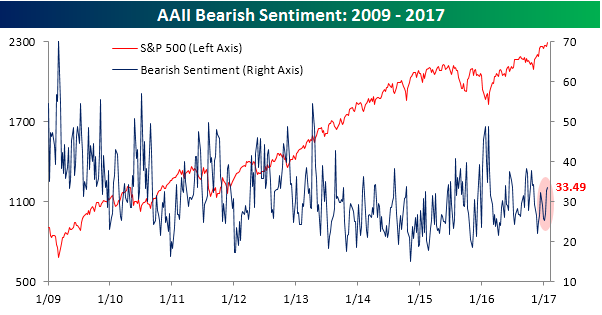
Bearish sentiment didn’t see much of an increase this week, rising from 32.68% up to 33.49%. The key here, though, is that bearish sentiment now exceeds bullish sentiment for the first time since the election. The DJIA may be at 20K, but individual investors want no part of it.
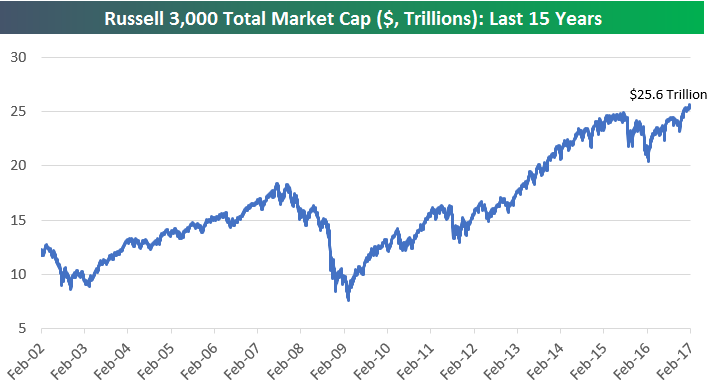
US Stock Market Tops $25 Trillion — Up $1.9 Trillion Since Election
Below is a chart of total stock market capitalization for stocks in the Russell 3,000 going back to 2002. We used the Russell 3,000 since its members make up more than 98% of US market cap.
As shown below, total US market cap has moved solidly above the $25 trillion mark over the last couple of weeks. Since Trump won on election night back in early November 2016, US market cap has risen $1.9 trillion. In case you’re wondering, US market cap rose $12.3 trillion from Election Day 2008 through Election Day 2016 ($11.4 trillion up to $23.7 trillion).
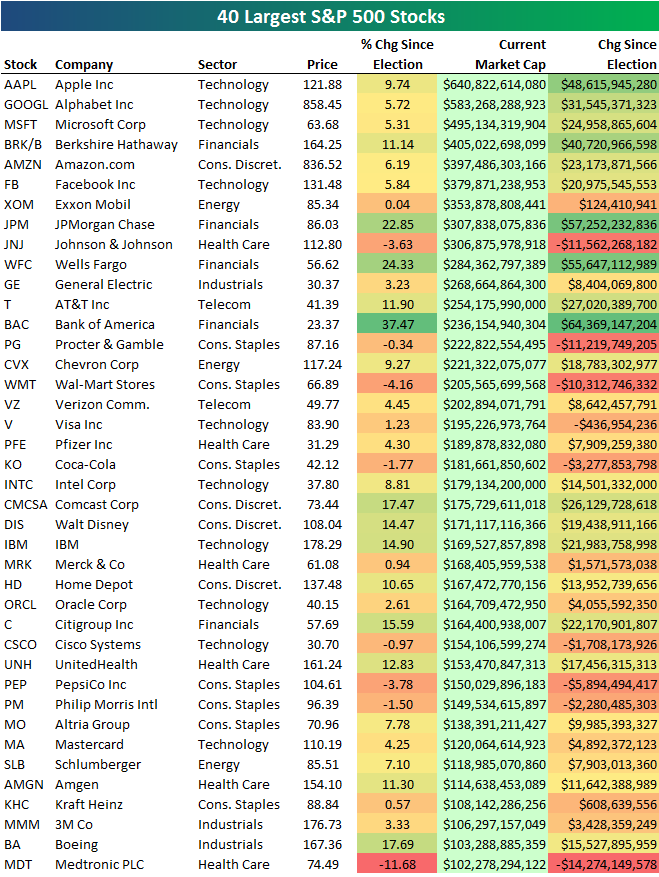
Below is a list of the 40 largest stocks in the US. In the table, we show how much each company’s market cap has increased or decreased since Election Eay 2016. As mentioned above, the US has seen its total market cap increase by $1.9 trillion over that span. The 40 largest stocks in the US account for $572 billion of that $1.9 trillion gain. Of the 40 largest stocks, it’s three behemoth Financial companies that have seen the biggest jumps in market cap since Election Day. Bank of America (BAC) has actually jumped the most with a 37% gain, which equates to $64.3 billion added in market cap. JP Morgan (JPM) has added $57 billion in cap, and Wells Fargo (WFC) has added $55.6 billion. You’ll likely notice that Goldman Sachs (GS) doesn’t even make the list. With a market cap of $99 billion, Goldman just barely misses the cut in the top 40. GS is currently the 44th largest stock in the S&P 500. When it comes to the Dow 30 gains since Election Day, though, Goldman — due to its high share price — has been the biggest contributor.
Apple (AAPL) has seen its market cap jump $48.6 billion since Election Day, while Alphabet (GOOGL) has jumped $31.5 billion. On a combined basis, Apple and Alphabet now add up to $1.22 trillion. Apple, Alphabet, Microsoft, Amazon.com, and Facebook add up to $2.5 trillion in cap.
Want to see more research like this? Click here to start a no-obligation two-week free trial.
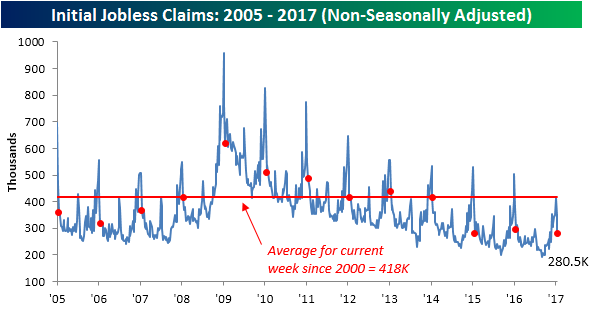
Jobless Claims Rise
It was a mixed jobless claims report this week as first-time claims rose from extremely low levels and came in higher than expected. While economists were expecting first time claims to come in at a level of 247K, the actual reading came in at 259K. That 22K increase in weekly claims was enough to rank as the largest one-week increase since April 2014. That said, even at 259K, current levels are extremely low by historical standards with the most recent print representing the 99th straight week where claims were below 300K.
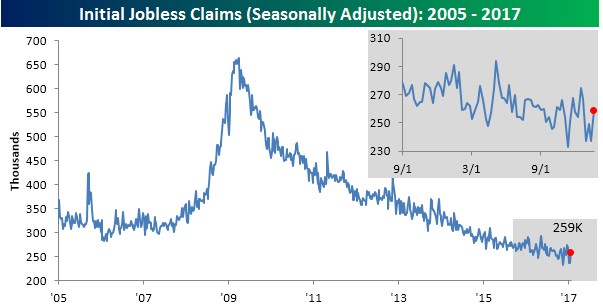
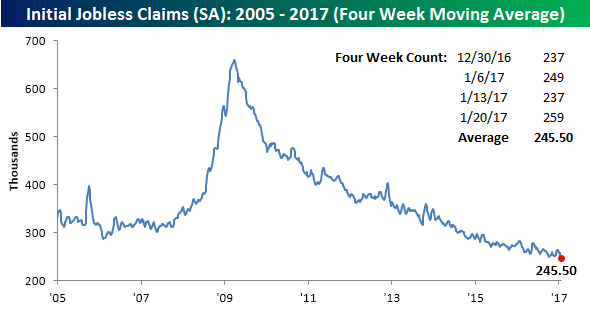
While this week saw a large increase in claims, because the number from four weeks ago was even higher, the four-week moving average actually declined to 245.5K from last week’s level of 247.5K. That puts the four-week moving average at its lowest level since November 1973.
On a non-seasonally adjusted (NSA) basis, the report was also positive as claims declined another 69.8K down to 280.5K. For the current week of the year, that’s the lowest reading since 1969, and is more than 137K below the average of 418K for the current week of the year dating back to 2000.