The Closer 2/1/17 – No March To Hikes?
Log-in here if you’re a member with access to the Closer.
Looking for deeper insight on global markets and economics? In tonight’s Closer sent to Bespoke Institutional clients, we summarize the FOMC decision today, break down construction spending, and recap auto sales reports today.

The Closer is one of our most popular reports, and you can see it and everything else Bespoke publishes by starting a no-obligation 14-day free trial to our research!
ETF Trends: US Sectors & Groups – 2/1/17
Energy names have gotten flat-out pounded over the last five sessions with Italy the only other ETF joining them atop the ranks of the worst performers. Small cap theme ETFs have also underperformed as have Transports, Homebuilders, and Retail. Winners include biotech and Health Care names (granted a more favorable regulatory outlook this week) while spot oil has actually performed pretty well despite carnage in Energy-related equities.

Bespoke provides Bespoke Premium and Bespoke Institutional members with a daily ETF Trends report that highlights proprietary trend and timing scores for more than 200 widely followed ETFs across all asset classes. If you’re an ETF investor, this daily report is perfect. Sign up below to access today’s ETF Trends report.
See Bespoke’s full daily ETF Trends report by starting a no-obligation free trial to our premium research. Click here to sign up with just your name and email address.
Chart of the Day: At What Level Will NXPI Be Better Off On Its Own?
Fixed Income Weekly – 2/1/17
Searching for ways to better understand the fixed income space or looking for actionable ideals in this asset class? Bespoke’s Fixed Income Weekly provides an update on rates and credit every Wednesday. We start off with a fresh piece of analysis driven by what’s in the headlines or driving the market in a given week. We then provide charts of how US Treasury futures and rates are trading, before moving on to a summary of recent fixed income ETF performance, short-term interest rates including money market funds, and a trade idea. We summarize changes and recent developments for a variety of yield curves (UST, bund, Eurodollar, US breakeven inflation and Bespoke’s Global Yield Curve) before finishing with a review of recent UST yield curve changes, spread changes for major credit products and international bonds, and 1 year return profiles for a cross section of the fixed income world.
In this week’s note, we take a look at big investment grade corporate bond issuance to start the year.
Our Fixed Income Weekly helps investors stay on top of fixed income markets and gain new perspective on the developments in interest rates. You can sign up for a Bespoke research trial below to see this week’s report and everything else Bespoke publishes free for the next two weeks!
Click here to start your no-obligation free Bespoke research trial now!
Quiet January
You would think that with all the headlines over the past month suggesting political chaos in Washington, it would have been a volatile January for stocks. With the first month of the year now in the books, though, it was among the most stable Januarys in terms of market performance we have seen in quite some time. For starters, the largest drawdown that the S&P 500 saw from a closing high during the month was just 0.85%, which is the smallest since last July.
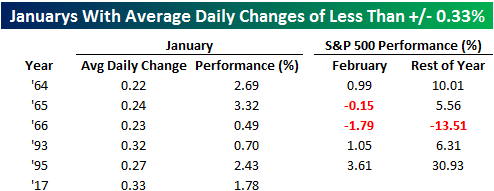
Even more impressive, though, was the S&P 500’s average daily percent change in January of just +/-0.33%. In the 1,069 months since 1928, January ranks as the 66th smallest average daily move for a given month in the S&P 500’s history. For the month of January specifically, there have only been five other Januarys where the S&P 500 saw an average daily percentage move that was smaller than this January. In the table below, we have highlighted each of those Januarys along with how the S&P 500 traded for the remainder of the year. As far as the month of February is concerned, quiet Januarys haven’t had any notable impact on market returns in February as the S&P 500 has been up three out of five times for a median gain of 0.99%. For the remainder of the year, the S&P 500 has been up a median of 6.31% with positive returns four out of five times, but here again, these results don’t show any meaningful variance from overall historical returns for all other years.
Manufacturing Accelerates Again
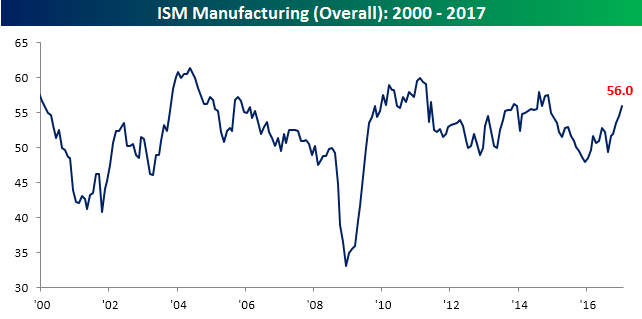
Based on today’s ISM Manufacturing report, manufacturing activity for the month of January jumped to its highest level in over two years. While economists were expecting the headline reading in the ISM Manufacturing report to come in at a level of 55.0, the actual reading rose to 56.0. That’s not only the highest monthly print since November 2014, but it also marks the fifth straight month that the index has shown a m/m increase. The last time we saw that much consistency in growth was in early 2012, when the ISM increased for six straight months. Going all the way back to 1948, the longest consecutive streak of monthly increases was from mid-1993 to mid-1994 when the headline ISM Manufacturing index increased for 12 straight months.
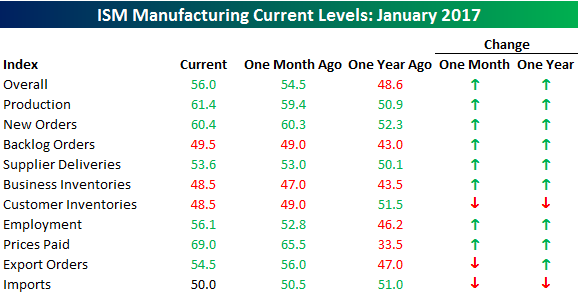
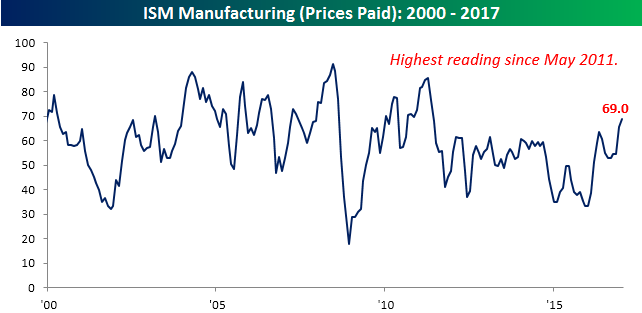
Not only was the headline index in this month’s report strong, but the internals also showed solid growth. As shown in the table below, of the index’s ten subcomponents, seven saw m/m increases, while eight out of ten are up y/y. The biggest increases this month were in Prices Paid (+3.5), Employment (+3.3), and Production (+2.0). The increase in Prices Paid is especially notable as that index is now at its highest level since May 2011, and over the last year, it has increased by 35.5 points (chart below)! Strong growth with rising prices? Not necessarily the news you want to see on an FOMC day.
Auto Sales Off To A Decent Start In 2017
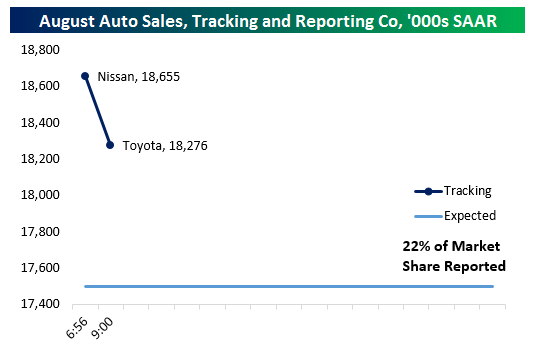
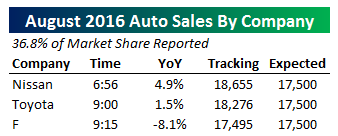 Early reports from US auto manufacturers suggest that the industry will beat strong sales figures recorded in December 2016. With three manufacturers (~25% of market share) reported, individual OEMs are coming in ahead of analyst estimates with Ford and Audi both producing strong results. When translated to seasonally adjusted annual sales rates, the first three reports track to a sales pace of about 18.2mm SAAR. That compares with 18.3mm SAAR reported last month and economist estimates of about 17.5mm SAAR. As we get more reports throughout the day, we will update the table at right and charts below.
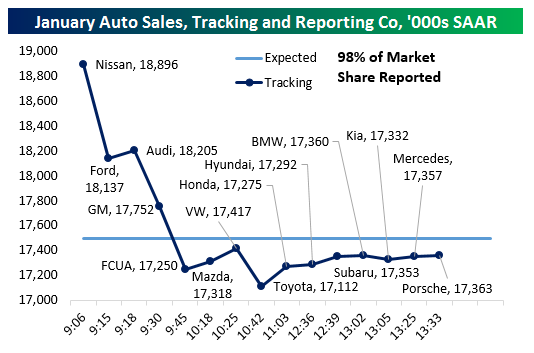
Update 1 9:40 AM: A bigger than expected drop for GM sales (3.8% versus the 2.4% decline forecast by analysts) led to a big swoon in our tracker. We are still showing the industry on pace to beat analyst estimates in the first month of 2017 but by a much narrower margin of +250,000 SAAR.
Update 2 10:15 AM: With over half the industry now reported, our tracker is indicating the US auto industry will miss analyst sales estimates in January, a huge shift from the big beat we were tracking an hour ago! As shown in the chart below, big sales pace declines from GM and Fiat-Chrysler contributed to the slowdown. That said, it could have been worse; while the Fiat-Chrysler sales numbers were down YoY, they were estimated to be 14% lower rather than the more digestible 11.2% decline reported.
Update 3 10:51 AM: While Mazda and Volkswagen delivered decent sales prints, both seeing double-digit YoY volume gains, Toyota announced an absolutely brutal miss with sales falling 11.3% YoY versus 2% declines expected. Now, with 75% of US auto sales market share reported, it’s very unlikely that the overall sales pace will be able to beat analyst estimates even if smaller, later-reporting companies generate large sales gains like those we’ve seen for Nissan, Audi, Mazda, and VW.
Update 4 1:57 PM: Since our last update, virtually all of the remaining market share has come in, with only Mitsubishi remaining unreported. While Subaru and Honda both reported solid months and the high end (Mercedes, Porsche) performing well, BMW and Hyundai saw middling sales while Kia reported a pretty soft result. Overall, it’s a slight positive given seasonal adjustments and we’re now tracking a bit of an improvement versus our last updated of 17.11mm SAAR. With 98% reported, auto sales should miss estimates and come in around 17.36mm to start 2017.
The Closer 1/31/17 – Uncertainty, Confidence, Wages, Houses, & North American Growth
Log-in here if you’re a member with access to the Closer.
Looking for deeper insight on global markets and economics? In tonight’s Closer sent to Bespoke Institutional clients, we discuss domestic and international economic data: policy uncertainty, consumer confidence, the employment cost index, Case-Shiller home prices, Chicago PMI, Mexican GDP, and Canadian GDP.
The Closer is one of our most popular reports, and you can see it and everything else Bespoke publishes by starting a no-obligation 14-day free trial to our research!