The Closer 2/3/17 – End of Week Charts
Looking for deeper insight on global markets and economics? In tonight’s Closer sent to Bespoke clients, we recap weekly price action in major asset classes, update economic surprise index data for major economies, chart the weekly Commitment of Traders report from the CFTC, and provide our normal nightly update on ETF performance, volume and price movers, and the Bespoke Market Timing Model.

The Closer is one of our most popular reports, and you can sign up for a trial below to see it and everything else Bespoke publishes free for the next two weeks!
Click here to start your no-obligation free Bespoke research trial now!
ETF Trends: Fixed Income, Currencies, and Commodities – 2/3/17
Turkey is up double-digits for US-based investors over the past week while gold miners, biotechs, and a number of EM countries have rallied. Sweden is also riding currency tailwinds. Natural gas continues to plunge while an esoteric range of US equity ETFs have undeperformed: steel, telecoms, transports, energy, and homebuilders.

Bespoke provides Bespoke Premium and Bespoke Institutional members with a daily ETF Trends report that highlights proprietary trend and timing scores for more than 200 widely followed ETFs across all asset classes. If you’re an ETF investor, this daily report is perfect. Sign up below to access today’s ETF Trends report.
See Bespoke’s full daily ETF Trends report by starting a no-obligation free trial to our premium research. Click here to sign up with just your name and email address.
The Closer 2/2/17 – Comfort And Productivity
Log-in here if you’re a member with access to the Closer.
Looking for deeper insight on global markets and economics? In tonight’s Closer sent to Bespoke Institutional clients, we update our tracking of differing consumer comfort across demographics, as well as updating labor productivity figures released today by the BLS.
The Closer is one of our most popular reports, and you can see it and everything else Bespoke publishes by starting a no-obligation 14-day free trial to our research!
ETF Trends: International – 2/2/17
Turkey has surged over the last few days as the country’s beaten-down equity and foreign exchange markets have gotten a breather. The same goes for biotechs and pharma, receiving positive comments from the Trump Administration this week, while Mexico has also rallied notably. Energy companies continue to top the worst performers list with Banks and homebuilders also declining.
Bespoke provides Bespoke Premium and Bespoke Institutional members with a daily ETF Trends report that highlights proprietary trend and timing scores for more than 200 widely followed ETFs across all asset classes. If you’re an ETF investor, this daily report is perfect. Sign up below to access today’s ETF Trends report.
See Bespoke’s full daily ETF Trends report by starting a no-obligation free trial to our premium research. Click here to sign up with just your name and email address.
Bespoke’s Consumer Pulse Report — January 2017
Bespoke’s Consumer Pulse Report is an analysis of a huge consumer survey that we run each month. Our goal with this survey is to track trends across the economic and financial landscape in the US. Using the results from our proprietary monthly survey, we dissect and analyze all of the data and publish the Consumer Pulse Report, which we sell access to on a subscription basis. Sign up for a 30-day free trial to our Bespoke Consumer Pulse subscription service here. With a trial, you’ll get coverage of consumer electronics, social media, streaming media, retail, autos, and much more.

Chart of the Day: Down Dollar Driving Stocks
A Third of Individual Investors Are Bullish
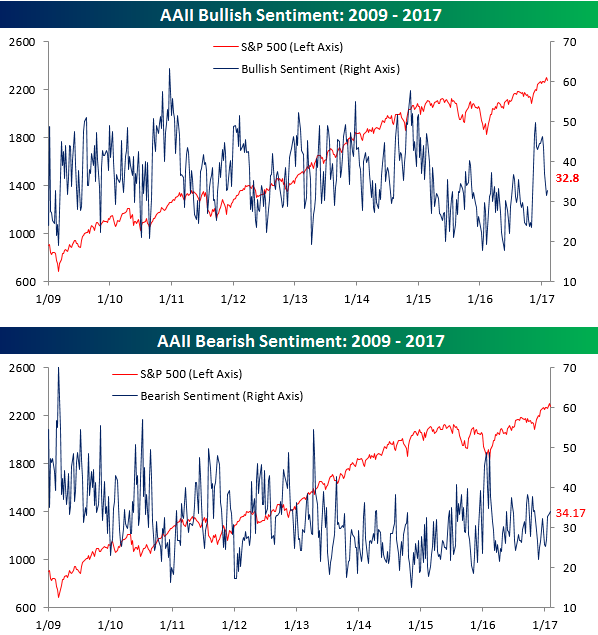
Bullish stock market sentiment from individual investors spiked immediately following Trump’s victory last November. There was a thought that this might mark the beginning of a new trend, but the bounce was short-lived. At this point, AAII bullish sentiment (which is reported weekly) is back down to where it was a couple of months before the election. This week’s bullish sentiment reading came in at 32.8%, which is up a point from where it stood last week. It appears as if the steep post-election rally that has taken the Dow up to 20,000 has individual investors concerned about stocks going “too far, too fast.” But that means that sentiment should start to increase again if we see a pullback. Unfortunately, sentiment readings don’t tend to work that way. Any market decline will likely get investors even more cautious.
With 32.8% bullish, 33.03% neutral, and 34.17% bearish, individual investor sentiment couldn’t get more evenly distributed. No wonder the market has been trendless with no upside or downside momentum experienced in weeks.
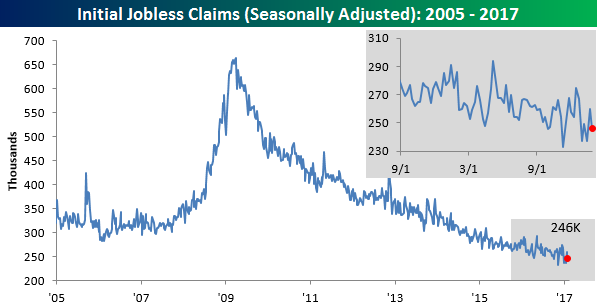
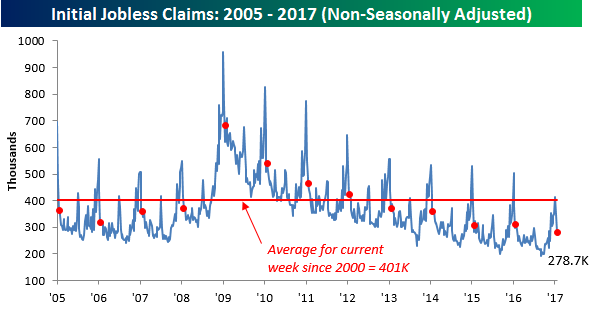
Initial Jobless Claims Back Below 250k
After jumping from 237,000 up to 260,000 last week, weekly initial jobless claims came in at 246,000 this week. That was 4,000 lower than the consensus of 250,000 that economists were expecting.
Jobless claims continue to come in remarkably low.
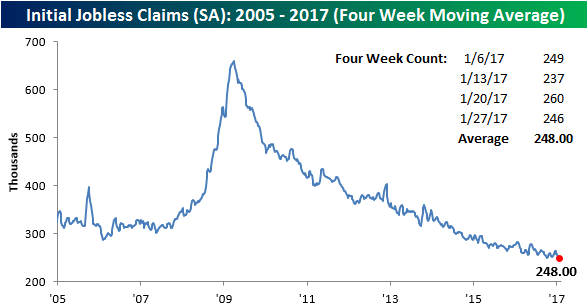
Below is a chart showing the 4-week moving average of weekly initial jobless claims. This helps to smooth things out. As shown, the current 4-week moving average stands at 248,000. Since 2000, the average of this 4-week moving average has been 366,000, so we’re currently 118,000 below that level.
The above readings have been seasonally adjusted, so what was the actual non-seasonally adjusted number this week? As shown below, it came in at 278,700. That means the seasonally adjusted number was adjusted down by roughly 30,000 this week. But if you look at the non-seasonally adjusted reading for this week of the year going back to 2000, the average has been 401k. So this week’s non-seasonally adjusted number was 123,000 below average. It was also the lowest reading for this week of the year seen since at least 2005. Pretty solid.
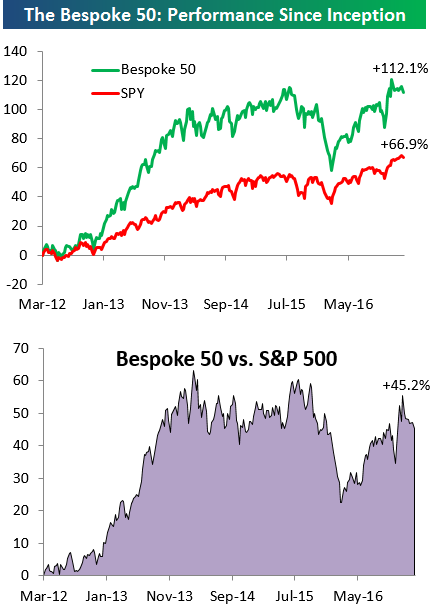
the Bespoke 50 — 2/2/17
Every Thursday, Bespoke publishes its “Bespoke 50” list of top growth stocks in the Russell 3,000. Our “Bespoke 50” portfolio is made up of the 50 stocks that fit a proprietary growth screen that we created a number of years ago. Since inception in early 2012, the “Bespoke 50” has nearly doubled the performance of the S&P 500. Through today, the “Bespoke 50” is up 112.1% since inception versus the S&P 500’s gain of 66.9%.
To view our “Bespoke 50” list of top growth stocks, sign up for Bespoke Premium ($99/month) at this checkout page and get your first month free. This is a great deal!
Bespoke’s Sector Snapshot — 2/2/17
We’ve just released our weekly Sector Snapshot report (see a sample here) for Bespoke Premium and Bespoke Institutional members. Please log-in here to view the report if you’re already a member. If you’re not yet a subscriber and would like to see the report, please start a 14-day trial to Bespoke Premium now.
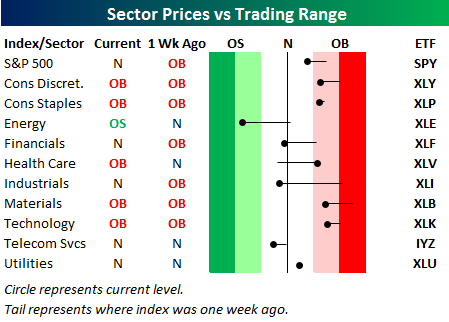
Below is one of the many charts included in this week’s Sector Snapshot, which highlights our trading range screen for the S&P 500 and ten sectors. The black vertical “N” line represents each sector’s 50-day moving average, and as shown, four of ten sectors are now below their 50-days. Three of these are sectors that did very well immediately following the election — Energy, Industrials, and Financials.
To see our full Sector Snapshot with additional commentary plus six pages of charts that include analysis of valuations, breadth, technicals, and relative strength, start a 14-day free trial to our Bespoke Premium package now. Here’s a breakdown of the products you’ll receive.