The Closer 2/10/17 – End of Week Charts
Looking for deeper insight on global markets and economics? In tonight’s Closer sent to Bespoke clients, we recap weekly price action in major asset classes, update economic surprise index data for major economies, chart the weekly Commitment of Traders report from the CFTC, and provide our normal nightly update on ETF performance, volume and price movers, and the Bespoke Market Timing Model.

The Closer is one of our most popular reports, and you can sign up for a trial below to see it and everything else Bespoke publishes free for the next two weeks!
Click here to start your no-obligation free Bespoke research trial now!
Emerging Markets Breakout?
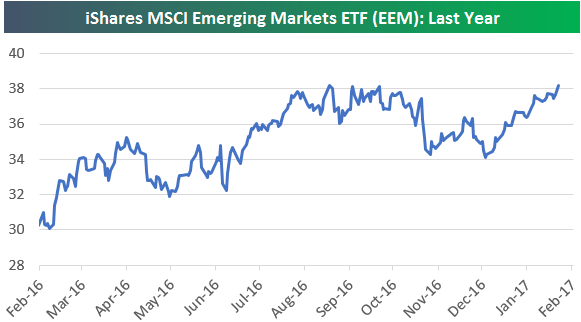
After experiencing a big drop in the immediate aftermath of Trump’s victory last November, the iShares MSCI Emerging Markets ETF (EEM) has rallied from $34 up to $38+ over the last couple of months. Today the ETF is trading just 10 cents away from a new 52-week high, which is at $38.32. As shown in the chart below, from a one-year perspective, EEM looks like it has nice breakout potential.
Start a 14-day free trial to see more of our earnings season research.
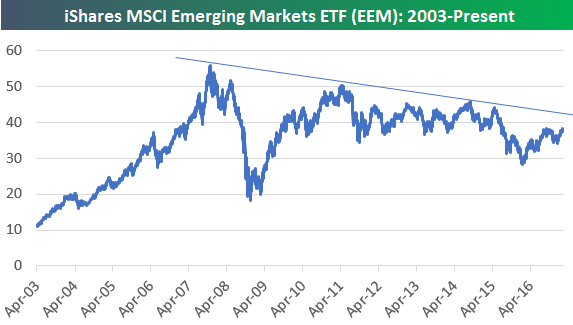
While the one-year chart looks bullish, the long-term chart for EEM going back to 2003 looks much less enticing. As shown below, the ETF — which is a way for US investors to gain exposure to the emerging markets asset class — has been making a series of lower highs for the last ten years now. To get above the top of the downtrend line that has formed, EEM needs to move into the mid-$40s, which is 20% higher from current levels.
Earnings Beat Rate Finishing Strong
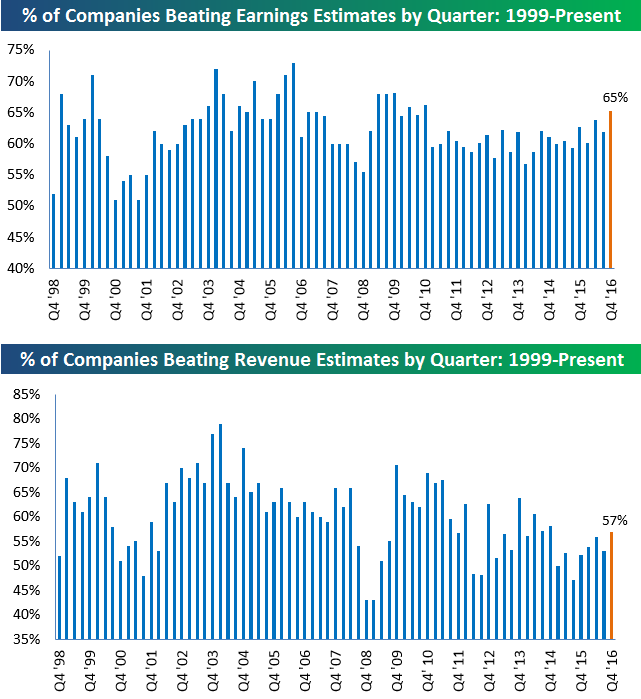
While guidance keeps getting worse and worse as earnings season progresses, the backward-looking earnings and revenue beat rates continue to come in strong. So far this earnings season, 65% of companies that have reported have beaten consensus analyst earnings per share estimates. As shown in the first chart below, 65% would be the strongest reading seen since Q3 2010 if it holds through the end of earnings season on February 21st (2/21 is when Wal-Mart reports — WMT marks the unofficial end to earnings season).
For top-line revenues, 57% of companies have beaten estimates this season. While not as strong as the bottom-line EPS beat rate, a revenue beat rate of 57% would be good enough for the strongest reading since Q4 2014.
Start a 14-day free trial to see more of our earnings season research.
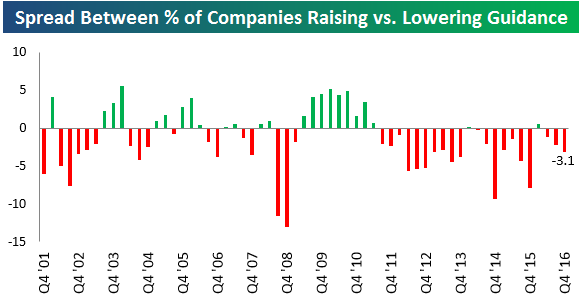
Guidance Gets Worse and Worse
Early on this earnings season, companies were raising guidance at a higher rate than they were lowering guidance. But over the last two weeks, guidance has gotten worse and worse, and at this point the number of companies that have lowered guidance far exceeds the number of companies that have raised guidance. Below is a look at the quarterly spread between the percentage of companies raising guidance minus lowering guidance going back to 2001. As shown, the current reading of -3.1 percentage points would be the weakest seen in a year.
Start a 14-day free trial to see more of our earnings season research.
ETF Trends: Fixed Income, Currencies, and Commodities – 2/10/17
Peripheral European equities have seen the worst returns over the last week or so with concerns about Greece and French elections serving to punish Spain and Italy. Energy-related assets, EM, and other foreign equities have been broadly weak. Looking to the positive, gold miners and other metals names continue to rally while China has jumped up over the last five sessions. Retail has also performed quite well overall.

Bespoke provides Bespoke Premium and Bespoke Institutional members with a daily ETF Trends report that highlights proprietary trend and timing scores for more than 200 widely followed ETFs across all asset classes. If you’re an ETF investor, this daily report is perfect. Sign up below to access today’s ETF Trends report.
See Bespoke’s full daily ETF Trends report by starting a no-obligation free trial to our premium research. Click here to sign up with just your name and email address.
The Closer 2/10/17 – Election Versus Inauguration
Log-in here if you’re a member with access to the Closer.
Looking for deeper insight on global markets and economics? In today’s Closer sent to Bespoke Institutional clients, we take a look at returns between the election and the inauguration versus returns since the inauguration.
The Closer is one of our most popular reports, and you can see it and everything else Bespoke publishes by starting a no-obligation 14-day free trial to our research!
Short Interest Report: 2/10/17
Bespoke Bloomberg TV Appearance (2/8/17)
Bespoke macro strategist George Pearkes appeared on Bloomberg TV’s “What Did You Miss” with Joe Weisenthal yesterday. To view the segment, please click on the image below.
Bespoke’s Sector Snapshot — 2/9/17
We’ve just released our weekly Sector Snapshot report (see a sample here) for Bespoke Premium and Bespoke Institutional members. Please log-in here to view the report if you’re already a member. If you’re not yet a subscriber and would like to see the report, please start a 14-day trial to Bespoke Premium now.
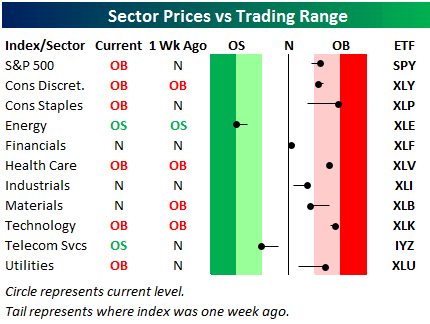
Below is one of the many charts included in this week’s Sector Snapshot, which highlights our trading range screen for the S&P 500 and ten sectors. The black vertical “N” line represents each sector’s 50-day moving average, and as shown, all but two sectors are currently above their 50-days. Consumer Staples is currently the most extended above its 50-day, while Energy is currently the most oversold.
To see our full Sector Snapshot with additional commentary plus six pages of charts that include analysis of valuations, breadth, technicals, and relative strength, start a 14-day free trial to our Bespoke Premium package now. Here’s a breakdown of the products you’ll receive.