As Neutral As It Gets
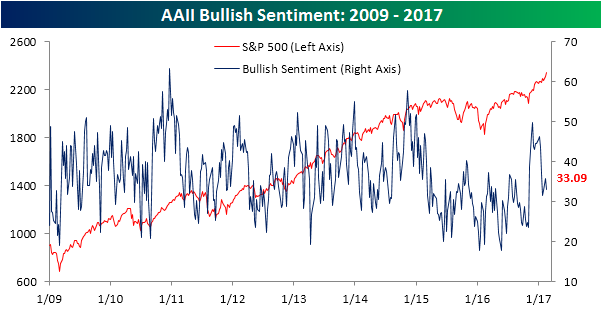
When it comes to market sentiment, the latest data from AAII shows a picture that is just about as neutral as it gets. However, given the fact that the S&P 500 and Nasdaq are currently in the middle of seven-day winning streaks, one would expect a little bit more conviction. As shown in the chart below, bullish sentiment this week came in at 33.09%. This is the fifth straight week that bullish sentiment has been below 40%, and the 111th straight week that bulls have failed to take a majority, and that makes this the longest sub 50% run in bullish sentiment in the history of the AAII survey. With bulls not even surpassing the one-third mark this week, the record streak looks set to continue for at least a little while longer.
Like the bulls, slightly less than a third (32.36%) of investors placed themselves in the bearish camp this week, but with stocks at record highs, you would expect a low level of bearish sentiment.
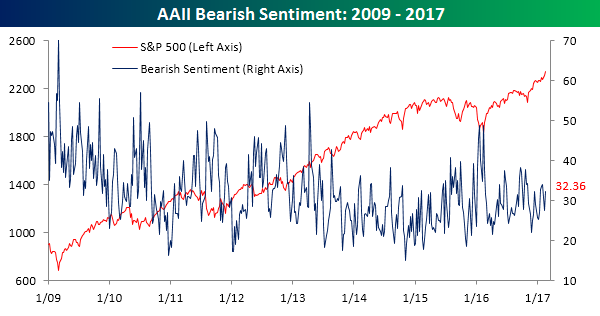
Finally, the only category of sentiment that was above one-third this week was neutral sentiment which came in at 34.55%.

Chart of the Day: Can Economic Surprises Keep It Up?
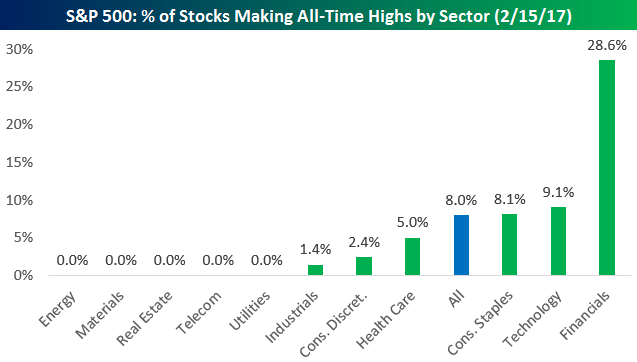
40 New All-Time Highs
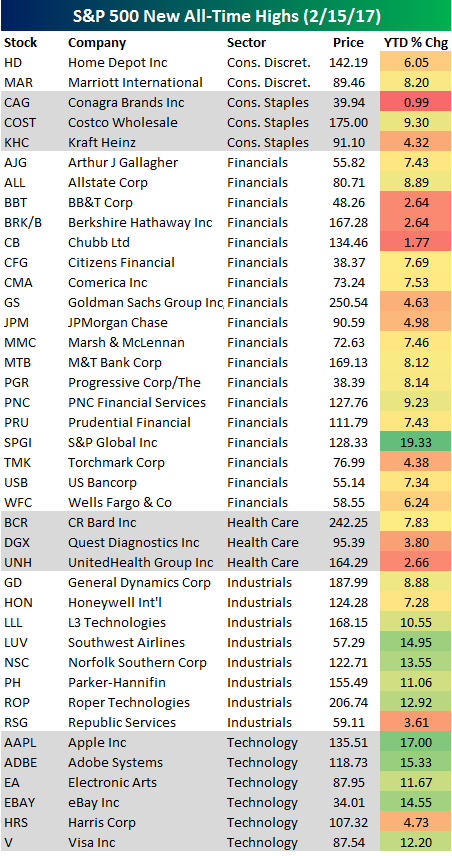
After 36 all-time highs on Monday and 24 on Tuesday, Wednesday’s reading was 40. So just under 10% of S&P 500 stocks hit all-time highs yesterday.
Below is yesterday’s full list of S&P 500 all-time highs. A whopping 28.6% of Financial sector stocks hit all-time highs, meaning a good chunk of the sector has now recovered all of its Financial Crisis losses.
The Closer — Data Deluge — 2/15/17
Log-in here if you’re a member with access to the Closer.
Looking for deeper insight on global markets and economics? In tonight’s Closer sent to Bespoke Institutional clients, we recap data today from the Mortgage Bankers’ Association (mortgage delinquencies and foreclosures), the Bureau of Labor Statistics (CPI), the Fed (industrial production), and the US Treasury (international capital flows).

The Closer is one of our most popular reports, and you can see it and everything else Bespoke publishes by starting a no-obligation 14-day free trial to our research!
Chart of the Day – Lucky Number Seven for the S&P 500 and Nasdaq
Fixed Income Weekly – 2/15/17
Searching for ways to better understand the fixed income space or looking for actionable ideals in this asset class? Bespoke’s Fixed Income Weekly provides an update on rates and credit every Wednesday. We start off with a fresh piece of analysis driven by what’s in the headlines or driving the market in a given week. We then provide charts of how US Treasury futures and rates are trading, before moving on to a summary of recent fixed income ETF performance, short-term interest rates including money market funds, and a trade idea. We summarize changes and recent developments for a variety of yield curves (UST, bund, Eurodollar, US breakeven inflation and Bespoke’s Global Yield Curve) before finishing with a review of recent UST yield curve changes, spread changes for major credit products and international bonds, and 1 year return profiles for a cross section of the fixed income world.
In this week’s note, we review recent pricing of Fed moves over the next year and following year, as well as looking at some mutual funds which should outperform in a rising rate environment.
Our Fixed Income Weekly helps investors stay on top of fixed income markets and gain new perspective on the developments in interest rates. You can sign up for a Bespoke research trial below to see this week’s report and everything else Bespoke publishes free for the next two weeks!
Click here to start your no-obligation free Bespoke research trial now!
ETF Trends: US Sectors & Groups – 2/15/17
Steel and solar are the unlikely duo sitting atop our list of the best performing ETFs over the past week. Brazil, Banks, South Africa, and Israel are other strong performers from the last five days. On the losing side of the coin long-term Treasuries, gold miners, natural gas, and the yen all continue to get destroyed. US equity yield plays like Utilities have underperformed while gold and other dollar crosses also lag.

Bespoke provides Bespoke Premium and Bespoke Institutional members with a daily ETF Trends report that highlights proprietary trend and timing scores for more than 200 widely followed ETFs across all asset classes. If you’re an ETF investor, this daily report is perfect. Sign up below to access today’s ETF Trends report.
See Bespoke’s full daily ETF Trends report by starting a no-obligation free trial to our premium research. Click here to sign up with just your name and email address.
Homebuilder Sentiment Drops For Second Straight Month
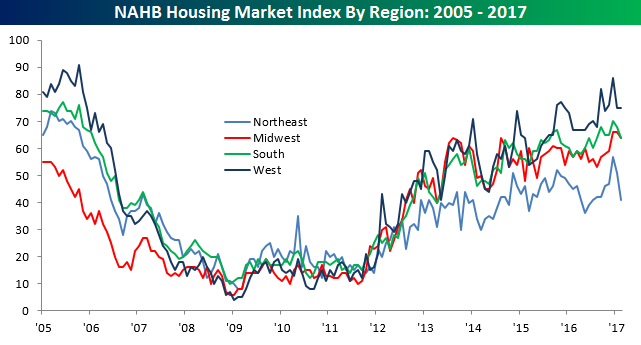
After an initial post-election surge which took homebuilder sentiment to its highest levels in over a decade, we’ve seen a bit of a dip in sentiment over the last two months. In this morning’s report from the NAHB for the month of February, sentiment dropped from last month’s level of 67 (and the consensus expectation for this month) down to 65. Looking at the long-term chart, however, the upward trend in sentiment remains intact.

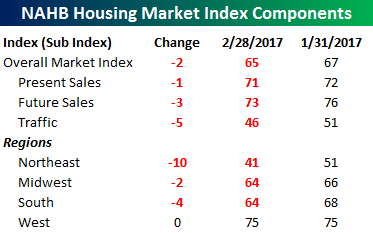 The table to the right breaks down this month’s report by present and future sales, traffic, and regions. Overall, sentiment weakened across the board with Traffic falling back below pre-election levels. On a regional basis, sentiment in the West was unchanged, the Midwest and South saw modest declines, but in the Northeast sentiment really plummeted, falling from 51 down to 41 for its lowest reading since last July.
B.I.G. Tips – Post Inauguration Decile Analysis
Empire Manufacturing Blows the Door Off
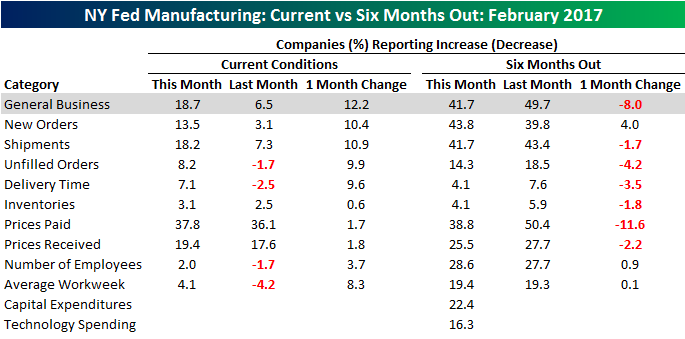
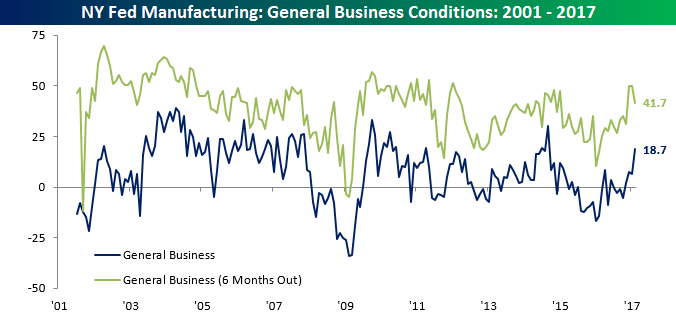
Manufacturing activity in the New York region continued to improve this month as the Empire Manufacturing report surged from 6.5 up to 18.7, which was the largest monthly increase since last June and the highest overall reading since September 2014. Relative to expectations, this month’s report was even stronger as it was the biggest ‘beat’ since May 2014. While the current conditions index increased this month, optimism about the future saw a bit of a dip, declining from 49.7 down to 41.7. However, given the wide gap between the two as of January’s report (second largest in five years), some narrowing was inevitable.
The table below breaks down the internals of this month’s Empire Manufacturing report. With regards to current conditions, breadth this month was very solid with every category increasing. The largest increases came from New Orders and Shipments, while Inventories, Prices Paid, and Prices Received saw the smallest increases. While sentiment towards current conditions was strong across the board, sentiment about future conditions was not nearly as rosy. As shown in the right hand side of the table, only New Orders, Number of Employees, and Average Workweek increased in February. Conversely, the biggest decline in terms of expectations came in Prices Paid. With weakness in Prices Paid and Prices Received on both a current and future basis, this should provide some comfort to investors worried about inflation.