Fixed Income Weekly – 2/22/17
Searching for ways to better understand the fixed income space or looking for actionable ideals in this asset class? Bespoke’s Fixed Income Weekly provides an update on rates and credit every Wednesday. We start off with a fresh piece of analysis driven by what’s in the headlines or driving the market in a given week. We then provide charts of how US Treasury futures and rates are trading, before moving on to a summary of recent fixed income ETF performance, short-term interest rates including money market funds, and a trade idea. We summarize changes and recent developments for a variety of yield curves (UST, bund, Eurodollar, US breakeven inflation and Bespoke’s Global Yield Curve) before finishing with a review of recent UST yield curve changes, spread changes for major credit products and international bonds, and 1 year return profiles for a cross section of the fixed income world.
In this week’s note, we take a look at the long trend in yields and what it could mean for bond portfolios if it breaks out to the upside…including a numerical example.

Our Fixed Income Weekly helps investors stay on top of fixed income markets and gain new perspective on the developments in interest rates. You can sign up for a Bespoke research trial below to see this week’s report and everything else Bespoke publishes free for the next two weeks!
Click here to start your no-obligation free Bespoke research trial now!
ETF Trends: Hedge – 2/22/17
Natural gas continues to get absolutely demolished with UNG falling 10.5% over the last 5 sessions.Spot prices fell 37% from their October high to the November 11 post-election low. Prices then surged 85% to the mid-December high before once again plunging, down 33% over the last 3 months. Oil services, gold miners, and Russia are also down significantly in the past week. Coffee, solar stocks, and Brazil continue to lead the rally among the best performers.

Bespoke provides Bespoke Premium and Bespoke Institutional members with a daily ETF Trends report that highlights proprietary trend and timing scores for more than 200 widely followed ETFs across all asset classes. If you’re an ETF investor, this daily report is perfect. Sign up below to access today’s ETF Trends report.
See Bespoke’s full daily ETF Trends report by starting a no-obligation free trial to our premium research. Click here to sign up with just your name and email address.
Bespoke CNBC Appearance (2/22)
Bespoke co-founder Paul Hickey appeared on CNBC’s Closing Bell on Tuesday to discuss the market outlook post earnings season. If you missed it, you can see the segment by clicking the image below.

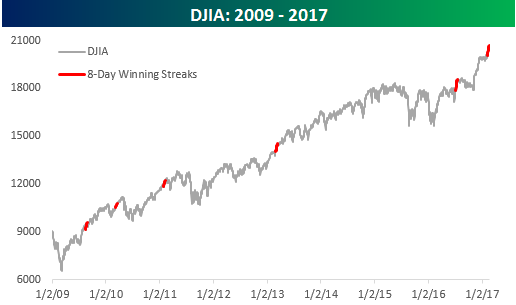
DJIA Eight Day Winning Streaks
With another day in the green yesterday, the Dow Jones Industrial Average (DJIA) saw its eighth straight day of gains, making the current streak the longest winning streak for the DJIA since last July’s post-Brexit rally, and just the sixth winning streak of this duration or longer during the current bull market (chart right). Prior to last July’s nine-day streak, you had to go all the way back to 2013 to find another winning streak of eight or more trading days.
In today’s Chart of the Day (available to all clients), we took a look at prior eight-day winning streaks for the DJIA to see how the index performed going forward including the odds of the hike continuing to day nine. The results may surprise you. If you are interested in seeing the results, start a 14-day free trial below and check it out!
The Closer — Peso Intervention, State of Homeownership — 2/21/17
Log-in here if you’re a member with access to the Closer.
Looking for deeper insight on global markets and economics? In tonight’s Closer sent to Bespoke Institutional clients, we take a look at the large intervention announced today by Mexico’s central bank and review annual vacancy and homeownership rates by state.
The Closer is one of our most popular reports, and you can see it and everything else Bespoke publishes by starting a no-obligation 14-day free trial to our research!
Chart of the Day: Hedge Fund Exposure
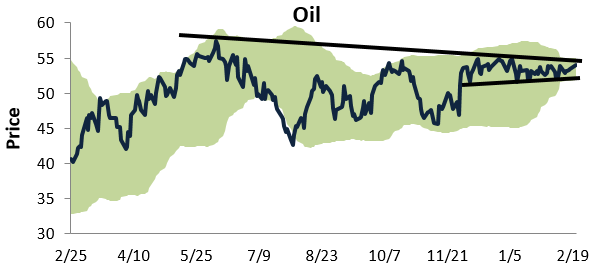
Oil Volatility Plummets
Much has been said about the drop in volatility that we’ve seen for equities, but we’ve also seen a big drop in vol for oil. You can see the tight sideways pattern that oil has formed over the last few months in the chart below:
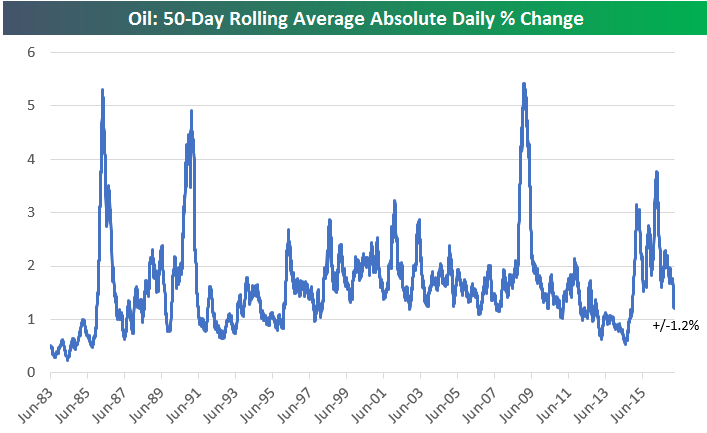
Over the last 50 trading days, oil has averaged an absolute daily change of +/-1.2%. That’s significantly lower than where things stood last year at this time. Below is a chart showing this reading on a rolling basis going back to 1983. During oil’s big price collapse from late 2014 through early 2016, volatility spiked significantly. In early 2016 when prices were about to bottom, oil had averaged a daily move of nearly +/-4% over the prior 50 trading days.
While the current reading of +/-1.2% is down sharply compared to a year ago, it’s still not close to the lows seen just prior to the peak for oil prices in late 2014. Back then oil was seeing daily moves of just over half a percent. Talk about a calm before the storm.
US Bull Market Chugs Along
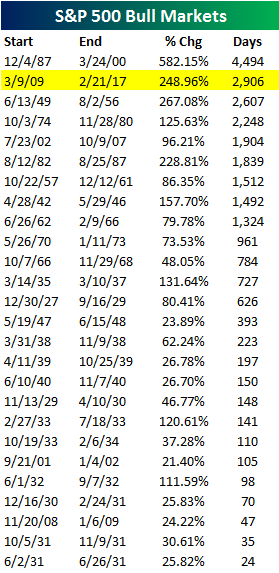
Below is an updated look at historical bull markets for the S&P 500 going back to its inception in 1928. Remember, the standard definition of a “bull market” is a 20%+ rally that was preceded by a 20%+ decline. We’ll leave the argument over what should or shouldn’t be considered a bull market for another day. Here we’re only reporting the numbers.
As shown below, the current bull market that began on March 9th, 2009 has now lasted 2,906 days. That makes the current bull the second longest on record by 299 days. The only bull market that lasted longer was the one that ran from December 1987 through March 2000. Remarkably, the S&P didn’t experience a decline of 20% on a closing basis over that entire 4,494-day period.
Another notable stat is that the current bull has now lasted more than 1,000 days longer than the previous bull that ran from July 2002 to October 2007.
In terms of strength, the current bull still ranks third best with a gain of 248.96%. To move into second place, the gain will need to eclipse the 267% rally seen from June 1949 through August 1956.
In case you’re wondering, the shortest bull market on record lasted just 24 days — occurring all inside the month of June 1931.
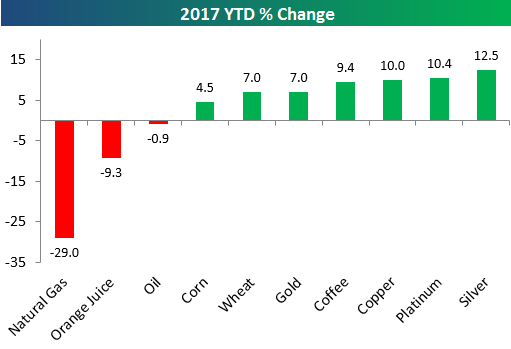
2017 Commodities Performance
Below is a look at the performance of major commodities so far in 2017. As shown, silver is up the most at +12.5%, followed by platinum (10.4%), copper (10.0%), and coffee (9.4%). On the downside, natural gas has been by far the biggest loser with a drop of 29%. Orange juice is down the second most at -9.3%, and oil is just barely in the red with a decline of 0.9%.
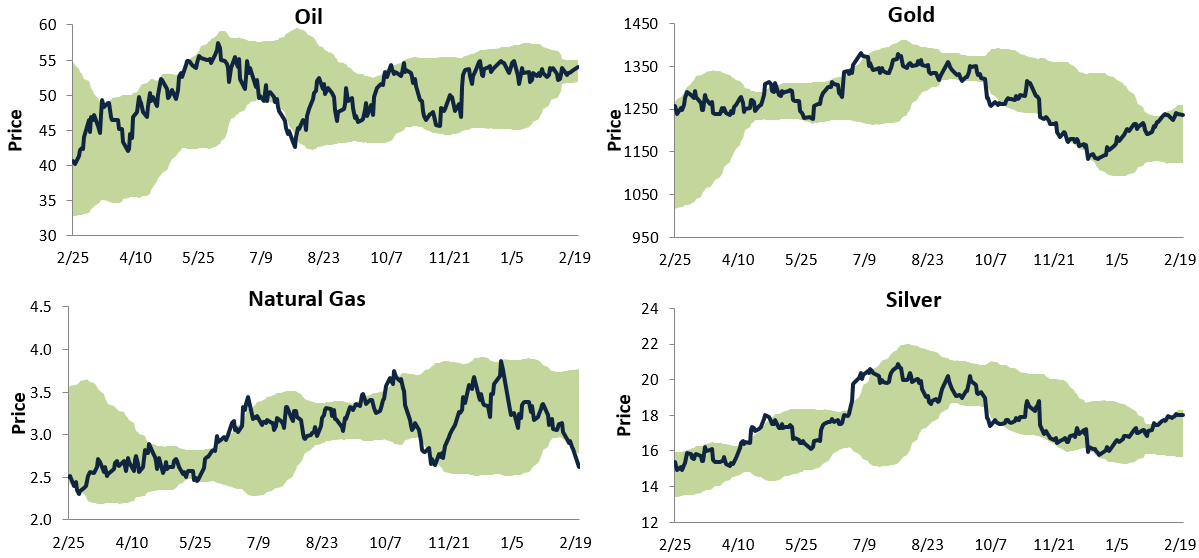
Below is a look at one-year price charts for oil, natural gas, gold, and silver. As shown, oil is right in the middle of what has become a very tight range, while natural gas has moved into extreme oversold territory. As of this morning, natural gas was trading more than two standard deviations below its 50-day moving average. Both gold and silver have recently moved to the top of their trading ranges, having recently broken above the top of their multi-month downtrend channels.
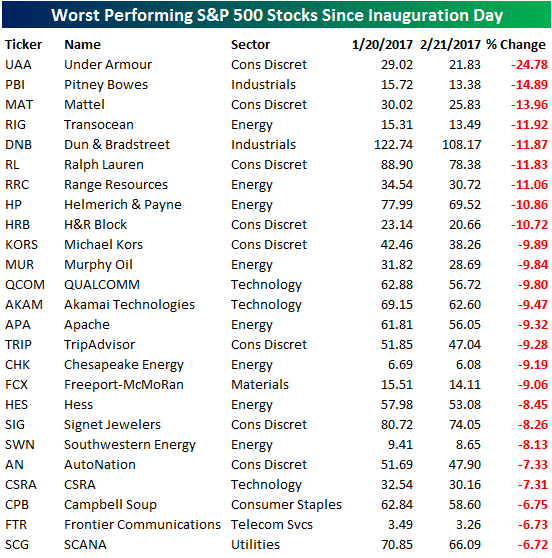
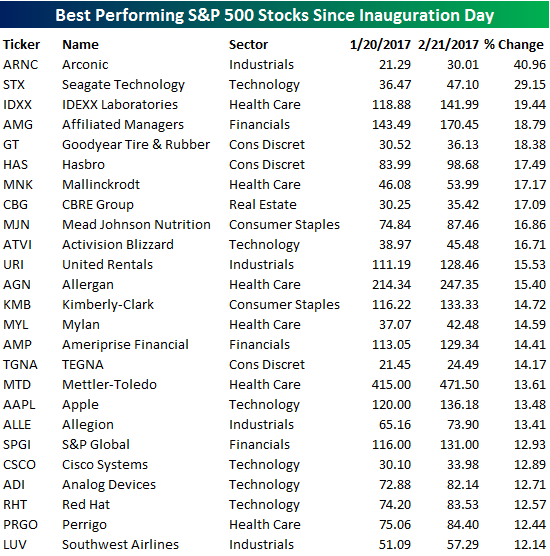
Best and Worst Performing Stocks Since the Inauguration
It has now been one full month since Donald J. Trump was inaugurated as President, and you may recall that the general consensus after the big post-election rally was that investors should “buy the Election and sell the Inauguration.” Even though the ‘buy’ part of the strategy was never mentioned until early January – well after the market rallied in November – the consensus trade was that all of the gains pre-Inauguration were being borrowed from the future and that investors would sell the news after Trump was sworn in. It has only been a month, but so far the strategy hasn’t quite panned out. Since Inauguration Day, the S&P 500 is up 3.3%, while the average performance of the 500 stocks in the index is even better at +3.6%.
In the tables below, we provide a brief summary of the S&P 500’s biggest winners and losers during the first full month under President Trump. The first table below lists the 25 biggest winners over the last month. Leading the way higher is Arconic (ARNC), which thanks to an activist investor, is up over 40%. Behind ARNC, Seagate Technology (STX) is the only other stock up more than 20%. Other notable names on the list include Apple (AAPL) and Cisco (CSCO). In terms of sector representation, it was surprising to see relatively few stocks from the Financials (3) and Industrials (4) sectors as they have been considered to be among the biggest winners under a President Trump. On the flipside, the sectors with the greatest representation are Technology and Health Care, each with six stocks. Both of these sectors did poorly on a relative basis to close out 2016, but investors have started coming around to them regardless of the President’s not-so-positive-relationship with the sectors.
To the downside, 117 stocks in the S&P 500 are down since the Inauguration, and below we list the 25 worst performers. Under Armour (UAA) has been the worst stock by far, losing close to a quarter of its value. Behind UAA, eight other stocks are down 10%, including other consumer names like Mattel (MAT), Ralph Lauren (RL), and H&R Block (HRB). In fact, Consumer Discretionary stocks have been especially hard hit under President Trump with eight of the worst 25 performers. Likewise, even though he has promised to decrease regulation and ease drilling restrictions, eight stocks from the Energy sector also made the list of 25 biggest losers. Perhaps there will be just too much oil coming out of the ground. One sector conspicuously absent from the list of biggest losers is Financials. While they may not be ripping under President Trump, Financials also haven’t been under pressure by any stretch.