The Bespoke Report – 2/24/17
When it comes to rankings, a “ten” is typically considered as good as it gets. In many sports, a “ten” is considered the best possible score. In 1976, Nadia Comaneci was the first gymnast to ever score a perfect ten when she was flawless on the uneven bars. Then, in 1979, Bo Derek also taught us that a ten was perfect.
 In 1984, the “perfect ten” was one-upped when ‘guitarist’ Nigel Tufnel from Spinal Tap introduced the world to amps that had a volume control that topped out at eleven. His reasoning was that every once in awhile there are those times where you have the volume up to ten and everything is going great but there is nowhere else to go from there. To solve the problem Tufnel tells the interviewer (played by Rob Reiner) that his amps go to eleven for those times when the band needs the “extra push off the cliff.”
This week, the DJIA was more than perfect, and like the amps from Spinal Tap, it pulled an eleven. And it did so in dramatic fashion, as the only time that the DJIA traded in positive territory was in the final seconds of the trading day. So where do we go from here?
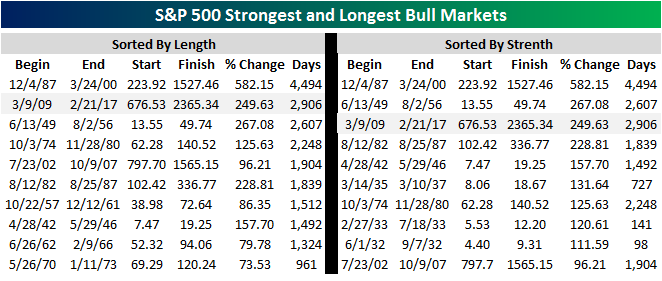
Along with the DJIA this week, all of the major averages hit new bull market and all-time highs, as one of the most unloved bull markets of all time continues to chug along. For the S&P 500, the current bull ranks as the second longest and third strongest of all time. While it will be some time before the current bull makes a run for the top spot in either category, in strength terms, a gain of 5% from here will put the current bull into second all-time as well.
Our just-published Bespoke Report newsletter (included weekly with all of our membership packages) includes a recap of the markets this week as well as what to expect going forward based on the events of the last week. If you’d like to read our thoughts in this week’s Bespoke Report newsletter, take advantage of our one-month Bespoke Premium free trial offer. Sign up now at this page.
Have a great weekend!
Bespoke’s Quick-View Chart Book — 2/24/17
Best Performing Stocks Around the World Since Trump’s Election
Learn more about Bespoke’s research and wealth management services.
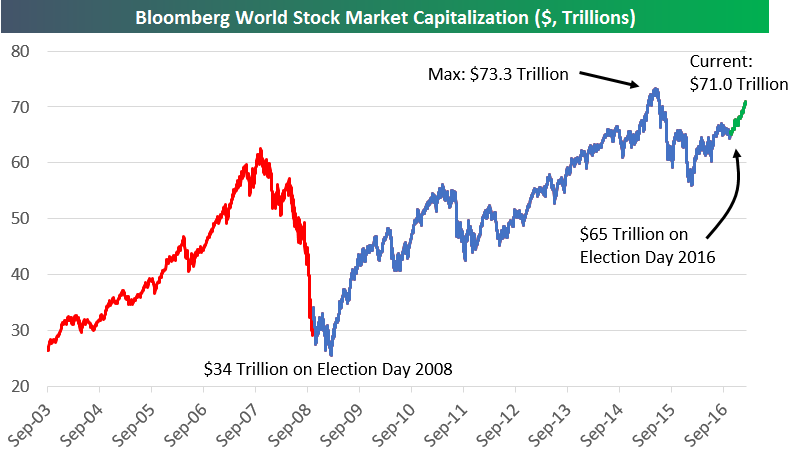
Below is a chart of the Bloomberg World Stock Market Capitalization index. The index tracks the market cap of all publicly traded equities across the globe. As shown, total world stock market cap currently stands at $71 trillion. While US stocks are at new all-time highs, this global index has yet to eclipse its high of $73.3 trillion seen back in 2015. Come on ‘rest of world’!
In the chart, we highlight the Obama Presidency (in blue) from election day 2008 through election day 2016. During that 8-year period, global stock market cap rose from $34 trillion up to $65 trillion. Since Trump’s election last November, we’ve seen global market cap rise another $6 trillion up to its current level of $71 trillion.
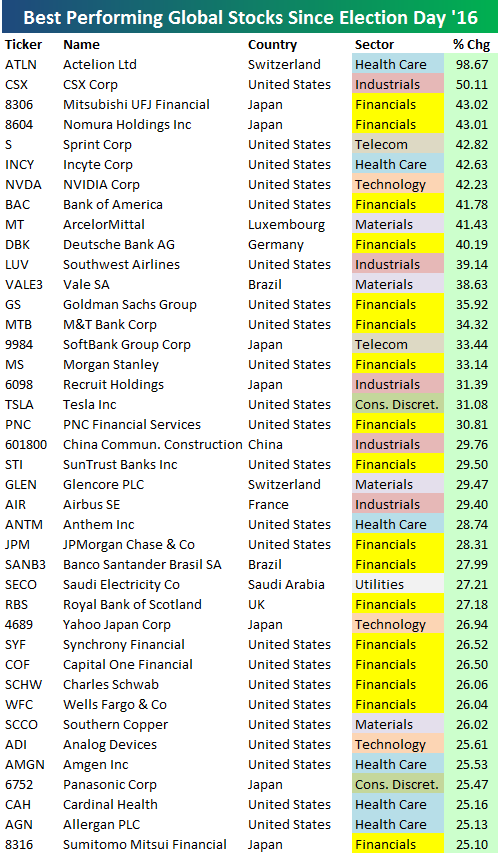
The table below highlights the 40 best performing stocks around the world since last November’s election in local currency terms (11/8/16 close). This list comes from a broader list of the 500 largest stocks in the Bloomberg World index. For each stock, we include its sector and the country that it’s headquartered in.
As shown, biotech firm Actelion out of Switzerland is up the most at +98.67%, followed by CSX Corp at +50.11% and Mitsubishi UFJ Financial (Japan) at +43.02%. Nomura Holdings (Japan) ranks 4th with a gain of 43.01%, and then Sprint Corp (S) rounds out the top five with a gain of 42.82%. Other notables in the top ten include NVIDIA (NVDA), Bank of America (BAC), and Deutsche Bank. Tesla (TSLA) ranks 18th with a gain of 31.08%.
Looking at sector representation, Financials dominate with 17 out of 40 stocks. Health Care stocks actually rank second with six names and Industrials rank third with five. Check back with us in a few months for an update!
To see Bespoke’s full line of macro and micro research, sign up for one of our premium membership options today! You won’t be disappointed.
The Closer 2/24/17 – End of Week Charts
Looking for deeper insight on global markets and economics? In tonight’s Closer sent to Bespoke clients, we recap weekly price action in major asset classes, update economic surprise index data for major economies, chart the weekly Commitment of Traders report from the CFTC, and provide our normal nightly update on ETF performance, volume and price movers, and the Bespoke Market Timing Model.

The Closer is one of our most popular reports, and you can sign up for a trial below to see it and everything else Bespoke publishes free for the next two weeks!
Click here to start your no-obligation free Bespoke research trial now!
Energy Sector Underperforming Oil Prices
The S&P 500 Energy sector is already down 7.1% year-to-date. That wouldn’t be so extreme if the broad S&P 500 were down a similar amount, but the S&P is currently sitting up 5.5% year-to-date.
Below is a chart of the Energy sector over the last two years. 2016 was a comeback year for the sector after a brutal 2015. Up until this week, the Energy sector had closed above its 200-day moving average every single trading day since April 11th, 2016. But as you can see below, that streak has come to an end. Today the sector broke hard below its 200-day.
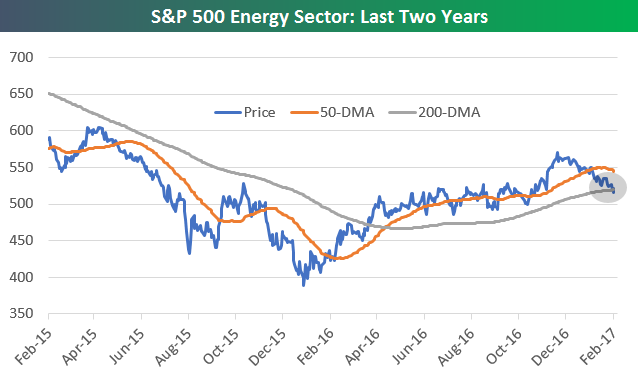
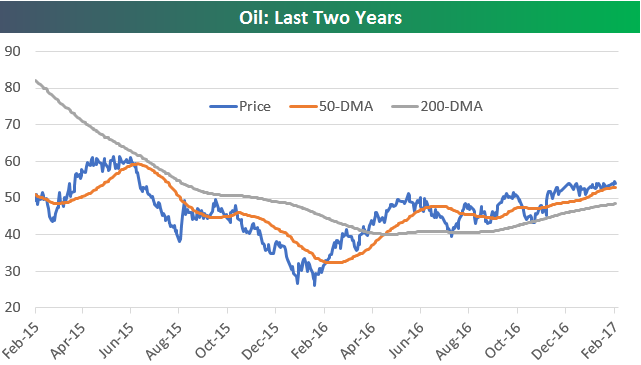
Normally, the Energy sector tracks movements in the price of oil somewhat closely, but that hasn’t been the case recently. The price of oil has held up well throughout this drop in Energy sector prices. As shown below, oil remains above not only its 200-day moving average, but it’s also above its 50-day moving average.
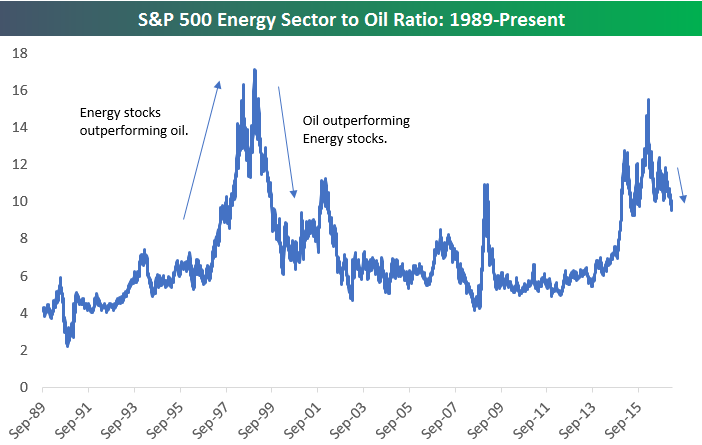
The recent divergence between oil and the Energy sector shows up in a chart of the ratio between the two. In the chart below, a rising line means Energy stocks are outperforming the price of oil. When the line is declining, oil is outperforming Energy stocks.
As shown, after a big spike in the ratio from 2014 through early 2016, we’ve seen the ratio dip lower and lower. Even after the drop, though, it’s still well above the range it traded in over a 12-year period from 2002 through 2014. A continuation of the current downtrend would basically mean that Energy stocks are set for further declines or oil is set to rally dramatically.
To see Bespoke’s full line of macro and micro research, simply sign up for one of our premium membership options today! You won’t be disappointed.
Bespoke’s New Beat Rate Tracker
If you’re not already aware, Bespoke maintains an interactive database that contains earnings report data for more than 4,000 US stocks. The database has more than 130,000 individual quarterly earnings reports on file going back to 2001, and there are a limitless ways for traders and investors to analyze the data.
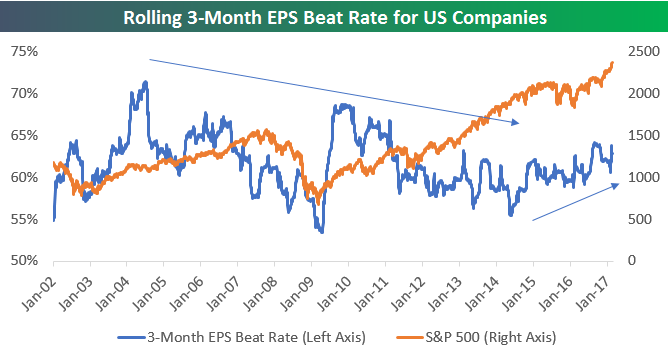
One of the things we track is whether or not a company beats or misses consensus EPS and revenue estimates. Using our database, which you can access by signing up for a Bespoke Institutional membership, below is a tracker we’ve created to follow the percentage of companies that have beaten EPS estimates on a rolling 3-month basis.
As shown, earnings beat rates have actually been trending slightly lower over the last 15 years. In the mid-2000s, the beat rate stayed consistently in a range between 60 and 70%. From 2011 through 2015, the range shifted lower from 55% to 60%. Only recently have we seen a steady uptick in the rolling 3-month beat rate that now stands at just under 63%.
In the chart you can see the performance of the S&P 500 as well. While this isn’t a great leading indicator, we did see the beat rate start to trend lower in 2006 ahead of the 2007 peak for the stock market. We also saw a huge spike in the beat rate at the very beginning of the current bull market that began in early 2009. In hindsight, that turned out to be an important tell.
The beat rate did, however, provide a false tell when it dipped to very low levels from late 2013 through mid-2014. Stocks never really skipped a beat during that period where companies were having a harder time meeting expectations.
No reading is perfect, but we find this particular tracker to be quite interesting and useful. We’ll continue to monitor it for spikes, drops, or divergences and report back to clients when we see them. If you’d like access to our beat rate tracker, simply sign up for one of our premium membership options today! You won’t be disappointed.
B.I.G. Tips – Earnings Season Summary Part 2
ETF Trends: International – 2/24/17
Utilities are the best performing ETF we track over the last five trading days. Solar stocks, EM, and long-term Treasury have outperformed along with “yield” stocks like REITs and staples. On the losing side of the equation, natural gas, mining, and steel lagged. European equities underperformed while Russia was the worst returner in emerging markets.

Bespoke provides Bespoke Premium and Bespoke Institutional members with a daily ETF Trends report that highlights proprietary trend and timing scores for more than 200 widely followed ETFs across all asset classes. If you’re an ETF investor, this daily report is perfect. Sign up below to access today’s ETF Trends report.
See Bespoke’s full daily ETF Trends report by starting a no-obligation free trial to our premium research. Click here to sign up with just your name and email address.
B.I.G. Tips – Earnings Season Summary
The Closer — Wage Data Buffet, Brazilian Loan Losses — 2/23/17
Log-in here if you’re a member with access to the Closer.
Looking for deeper insight on global markets and economics? In tonight’s Closer sent to Bespoke Institutional clients, we review key points from the Fed minutes. We also chart up the latest housing data on existing home sales updated today.
The Closer is one of our most popular reports, and you can see it and everything else Bespoke publishes by starting a no-obligation 14-day free trial to our research!