Bespoke CNBC Appearance (2/28/17)
Bespoke Co-Founder Paul Hickey appeared on CNBC’s Closing Bell on Tuesday to discuss markets and recent earnings. To view the segment, please click on the image below.
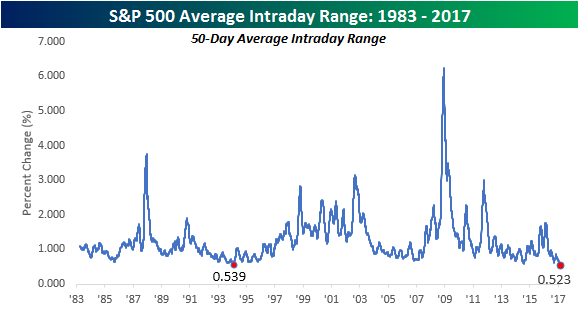
Record Low Intraday Range
In a post on Monday, we noted that the average intraday range for the S&P 500 over the last 50 trading days had reached its second narrowest level on record, and that if the S&P 500 did not trade in a range of more than 1% on Tuesday that it would be the narrowest average range in a 50-trading day period on record. Well, in Tuesday’s trading the S&P 500’s intraday range came in at just 0.37%, pushing the 50-day average intraday high/low range down to 0.523%, which is the lowest level since at least 1983 when our historical database begins.
Tuesday also marked the 50th straight trading day that the S&P 500 went without an intraday trading range of 1% or more. The chart below shows streaks where the index went without a 1% intraday range, and the current streak is far and away the longest on record since at least 1983 (when our data begins). Now that’s a lack of volatility!

The Closer — Time For Loonie Longs — 2/28/17
Log-in here if you’re a member with access to the Closer.
Looking for deeper insight on global markets and economics? In tonight’s Closer sent to Bespoke Institutional clients, we discuss an opportunity in USDCAD, chart up US home prices, and discuss the recent wave of commentary laying the ground for a March rate hike from the FOMC.

The Closer is one of our most popular reports, and you can see it and everything else Bespoke publishes by starting a no-obligation 14-day free trial to our research!
ETF Trends: US Indices & Styles – 2/28/16
Utilities have surged over the past week as the long end of the US yield curve has rallied despite rising expectations for a March rate hike (which now stand at about 2:1 in favor per Fed Funds futures contracts). Silver, Biotech, Long Bonds, and Natural Gas (recovering from a brutal winter) have all rallied. Gold miners have plunged while miners, steel producers, Brazil, and Russia are down the most over the last week among ETFs we track.

Bespoke provides Bespoke Premium and Bespoke Institutional members with a daily ETF Trends report that highlights proprietary trend and timing scores for more than 200 widely followed ETFs across all asset classes. If you’re an ETF investor, this daily report is perfect. Sign up below to access today’s ETF Trends report.
See Bespoke’s full daily ETF Trends report by starting a no-obligation free trial to our premium research. Click here to sign up with just your name and email address.
Bespoke Stock Scores: 2/28/17
Short Interest Report: 2/28/17
Chart of the Day – ‘Forgotten Man’ Already Feeling Forgotten
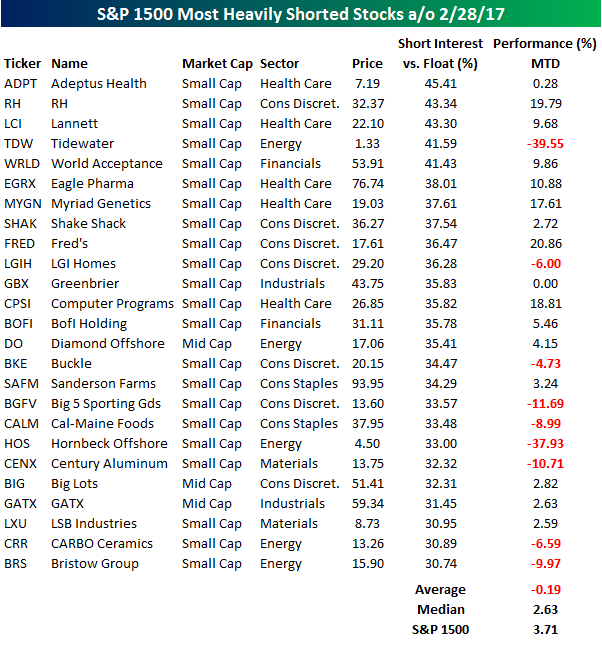
S&P 1500 Most Heavily Shorted Stocks
Short interest figures for the middle of February were released after the close last night, and we just sent out our regular update of the release to Bespoke Premium and Institutional clients. Be sure to check it out by signing up for a Bespoke Premium membership, because the latest data is full of interesting trends. In the table below, we have provided a list of the 25 S&P 1500 stocks with the highest short interest as a percentage of float (SIPF). All 25 stocks listed have more than 30% of their free-floating shares sold short. To see this many stocks with so much of their free-floating shares sold short is a bit of a surprise given the market is trading at all-time highs, but maybe the shorts know something the rest of the market doesn’t.
Overall, the average February performance of the 25 stocks shown is a decline of 0.19%, which is pretty bad given the strength we have seen in the broader market. However, much of the weakness is confined to two stocks, as both Tidewater (TDW) and Hornbeck Offshore (HOS) have lost more than a third of their value. On a median basis, the returns are much more respectable at a gain of 2.63%, but that’s still more than a full percentage point behind the performance of the S&P 1500.
Finally, while a lot of the stocks listed aren’t household names, one trend that stands out is the large presence of retailers. Of the 25 names listed, seven are retailers of some sort or another. Given the pressure this group has been under, that’s not a surprise. What is surprising, though, is that some of these names like RH (formerly Restoration Hardware), Shake Shack (SHAK), and Big Lots (BIG) are actually up on the month.
Bespoke’s Global Equity Markets Trading Range Screen — Russia Falters
Learn more about Bespoke’s research and wealth management services.
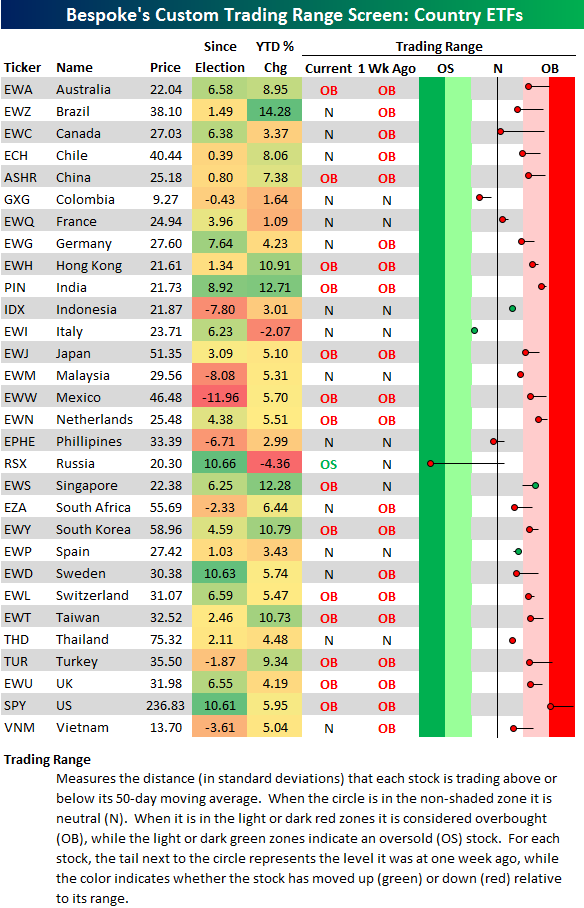
Below is a look at our trading range screen for the 30 largest country stock market ETFs traded on US exchanges. While nearly all countries remain above their 50-day moving averages, we’ve seen a steady drift lower in most parts of the world over the last week. Even the US (SPY) has ticked lower, but it’s still the most overbought country in the world right now — trading at 2 standard deviations above its 50-DMA.
The country that stands out the most on the screen is Russia (RSX). While Russia is still the best performing country since the election last November, it’s now just barely ahead of the US and Sweden. Over the last week, RSX has moved from trading just above its 50-day to trading well into extreme oversold territory.
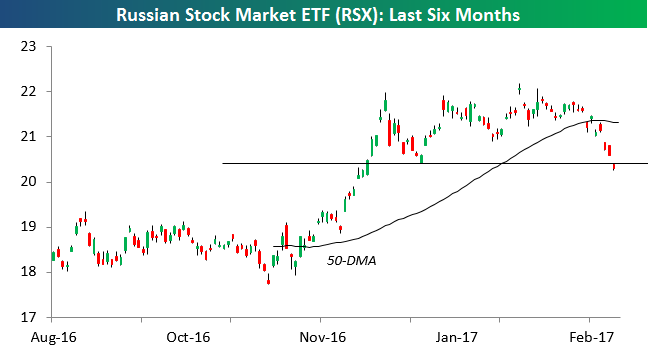
Below is a six-month chart of RSX. After gapping up to new highs a few weeks ago, we’ve seen a steady trend lower that has culminated with a big break below support today.
To see Bespoke’s full line of macro and micro research, sign up for one of our premium membership options today! You won’t be disappointed.
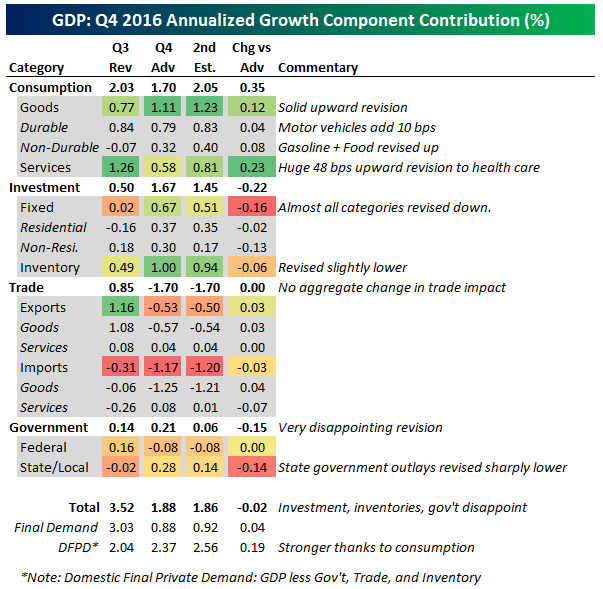
Second Estimate of Q4 GDP: Consumers Pick Up Business And Government Slack
Below we tabulate the contribution to QoQ seasonally adjusted annual rate growth in Q4. Total growth reported by the BEA in its second estimate of real output was little changed, revised down by all of 2 bps QoQ SAAR to 1.86% QoQ SAAR versus 1.88% in the Advance release. While there was little change to the headline, it came in below consensus expectations for a revision up to 2.1%. Consumption was more than all of that growth in this estimate, adding 2.05% to headline versus 1.70% in the Advance estimate thanks to upward revisions in Motor Vehicles (10 bps contribution) and Gasoline as well as Food in the Nondurable goods category. Upward revisions to Health Care Services spending alone added 48 bps to growth versus the first estimate of GDP. Unfortunately, other categories were less positive. Investment’s contribution to total growth was revised down by 22 bps, with most major categories of private fixed investment being revised lower at the margin. Trade in aggregate went unrevised, with exports and imports revised up by the same amount on a contribution basis (higher imports reduces their contribution to GDP growth). Finally, government spending was revised sharply lower in a disheartening result that saw the contribution to growth from state and local government spending cut in half.