B.I.G. Tips – Checking Up on Biotech
B.I.G. Tips – S&P 500 Intra-Month Performance in March
S&P 500 P/E Ratio Crosses Above 22
Keep in mind that as stocks keep rallying here, valuations are rallying as well. The 12-month trailing P/E ratio for the S&P 500 just crossed above 22 today. That’s 5.5 points above the index’s average P/E of 16.56 going back to 1954. Below is a chart showing the S&P’s trailing 12-month P/E over this 60+ year time frame. We’ve provided dates for previous highs that were reached.

Chart of the Day – How Recent Market Returns Stack Up
Fixed Income Weekly – 3/1/17
Searching for ways to better understand the fixed income space or looking for actionable ideals in this asset class? Bespoke’s Fixed Income Weekly provides an update on rates and credit every Wednesday. We start off with a fresh piece of analysis driven by what’s in the headlines or driving the market in a given week. We then provide charts of how US Treasury futures and rates are trading, before moving on to a summary of recent fixed income ETF performance, short-term interest rates including money market funds, and a trade idea. We summarize changes and recent developments for a variety of yield curves (UST, bund, Eurodollar, US breakeven inflation and Bespoke’s Global Yield Curve) before finishing with a review of recent UST yield curve changes, spread changes for major credit products and international bonds, and 1 year return profiles for a cross section of the fixed income world.
In this week’s note, we review how the long end of the yield curve has reacted to every interest rate hike from the Fed since 1994, putting in context the current curve flattening.

Our Fixed Income Weekly helps investors stay on top of fixed income markets and gain new perspective on the developments in interest rates. You can sign up for a Bespoke research trial below to see this week’s report and everything else Bespoke publishes free for the next two weeks!
Click here to start your no-obligation free Bespoke research trial now!
ETF Trends: Hedge – 3/1/17
Biotechs and homebuilders have led the US equity rally over the past five days. Internationally, Spain and Italy have taken off and the broad equity performance in Europe has been very strong thanks in part to greater optimism around the outcome of French elections. On the losing side of the slate, gold miners have gotten crushed while Brazil and Canada have been the weakest.

Bespoke provides Bespoke Premium and Bespoke Institutional members with a daily ETF Trends report that highlights proprietary trend and timing scores for more than 200 widely followed ETFs across all asset classes. If you’re an ETF investor, this daily report is perfect. Sign up below to access today’s ETF Trends report.
See Bespoke’s full daily ETF Trends report by starting a no-obligation free trial to our premium research. Click here to sign up with just your name and email address.
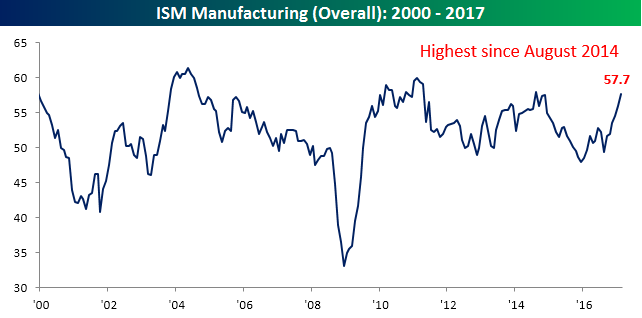
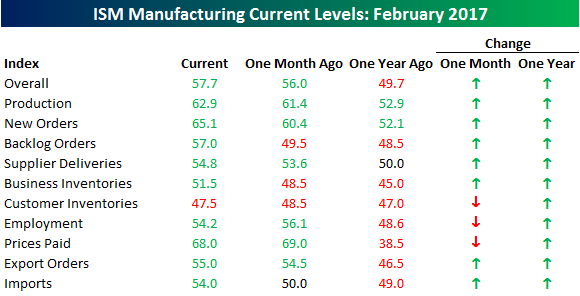
Two and a Half Year High For ISM Manufacturing
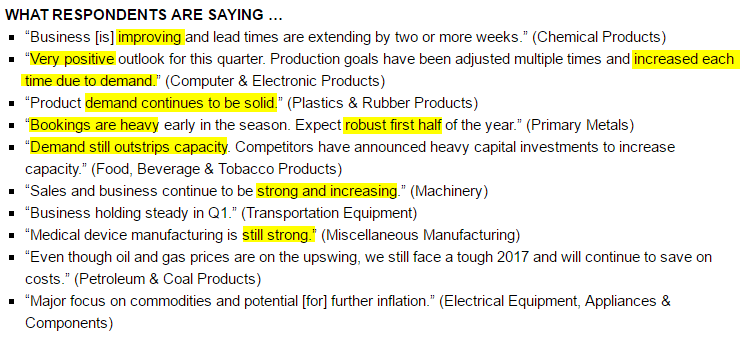
The ISM Manufacturing report for the month of February came in with another strong report, rising to 57.7 from last month’s reading of 56.0 and expectations for a reading of 56.2. This month’s reading was the highest since August 2014 and was the sixth better than expected report in a row. That’s the longest stretch of better than expected reports since the seven-month run from June through December of 2013. Before getting into the details of the report, we first wanted to highlight what the respondents were saying. We can’t remember a report where they sounded this bullish.
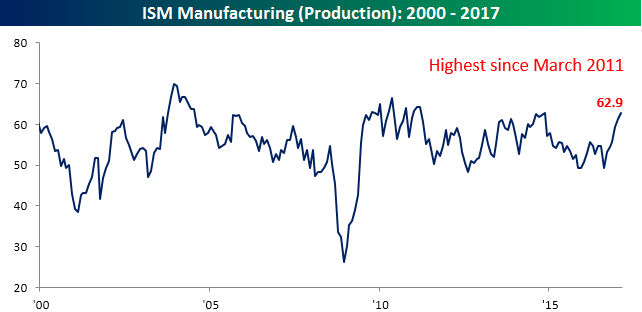
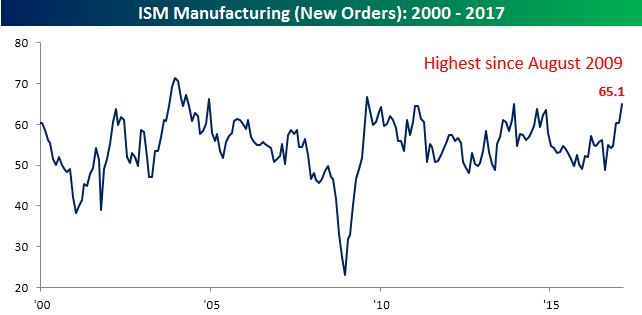
The chart below shows the headline reading in the ISM Manufacturing report going back to 2000. There hasn’t been such a sustained run higher in the monthly readings since the beginning of the economic expansion.
The table below shows the m/m and y/y change in each of the ISM’s various subcomponents. Relative to last month, we saw broad-based strength with just three categories (Customer Inventories, Employment, and Prices Paid) showing declines relative to January and every category rising on a y/y basis.
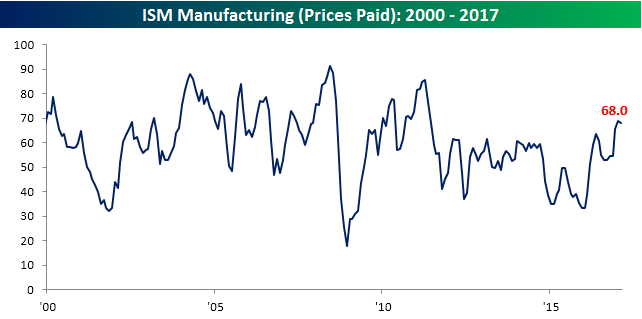
Finally, there are three charts we wanted to specifically highlight. Production rose for the sixth straight month, rising to its highest level since March 2011, while New Orders surged to their highest level since the early months of the economic expansion. Finally, with practically every other component rising, Prices Paid took a breather this month, posting a slight decline from last month, which was the highest level since 2011.
To see Bespoke’s full line of macro and micro research, simply sign up for one of our premium membership options today! You won’t be disappointed.
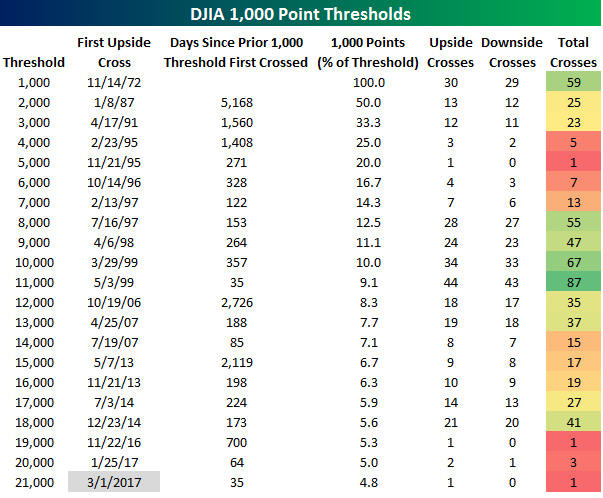
A 1,000 Here, A 1,000 There…
For the third time in less than 100 days, the DJIA is on pace to surpass a new 1,000 point milestone for the first time. Today, it looks like 21,000 will go down just 35 calendar days after first closing above 20,000. If the current levels hold, it will be tied for the quickest run to a new thousand-point threshold after first surpassing the prior one. Back in 1999, the DJIA took down 11,000 just 35 days after first surpassing 10,000 for the first time. Given that 1,000 points is a much smaller percentage of 21,000 (4.8%) than it is of 11,000 (9.1%), the current run isn’t nearly as impressive as the 35-day run in 1999, but the bulls will take it.
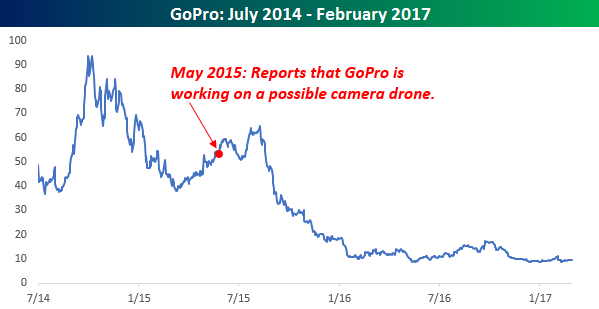
Snap Pulling Out All the Stops
The IPO of Snap is just a day away, and despite criticism regarding the voting structure of the shares being offered and the company’s expectations that investors who get in on the IPO hold the stock for at least a year, interest in the stock is high. According to the WSJ, the IPO is expected to price in a range of $17 to $18 per share, which is above the original target range of $14 to $16 and would value the company at around $25 billion. What is interesting about some of Snap’s messaging in the last few weeks is how it has been trying to move away from branding itself as a social media company and instead as a camera company. Even this morning, we saw stories about how the company has been working on a possible drone.
Haven’t we heard something similar to this before? All this talk from Snap about positioning itself as a mix between a social media and a camera company brings up memories of GoPro, but from the other direction. GoPro was originally a camera company and tried to woo new investors by branding itself as a social media play. Now, we have Snap starting off as a social media play trying to position itself as a camera company. Even the reports of a possible drone coming from Snap is similar to a ‘leak’ from Go-Pro back in May 2015 teasing investors that the company was working on a drone of its own. When that news came out, the stock saw an initial bounce, but the rally was short-lived. For those investors looking to get in on Snap tomorrow, let’s hope that since Snap is moving in the opposite direction as GoPro (social media company trying to position itself as a camera company rather than a camera company trying to position itself as a social media play), the outcome for the stock is in the opposite direction as well.
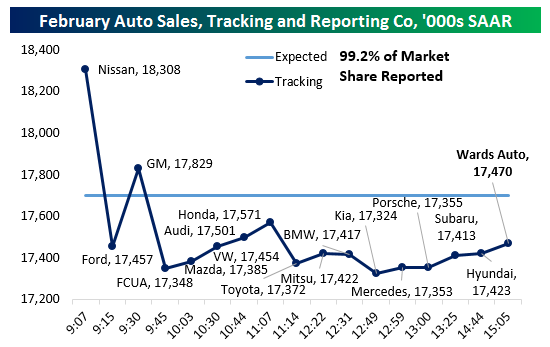
Auto Sales Tracking A Miss Early
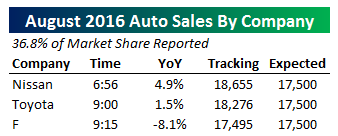 Nissan reported strong sales numbers ahead of the rest of the US auto industry this morning, but as we noted earlier on Twitter, Nissan hasn’t been a good indicator of the overall direction for the industry. Ford’s report brought the industry sales pace down to a bit less than 17.5mm. That would be a miss versus analyst estimates and a very small decline versus last month’s numbers. Of course, it’s still early; only two manufacturers representing 26% of the industry’s volumes have reported. We’ll be updating this post throughout the day as more numbers are announced by other auto OEMs.
Update 1 10:06 AM: Since Ford’s report, we got strong numbers from GM and Mazda and a weak month from Fiat-Chrysler. That brings the total tracking rate for the industry to 17.385mm with almost 60% of the industry reported. The last large manufacturer still to report is Toyota, but the smaller OEMs can also make a big impact in the afternoon so it’s possible total sales won’t miss still.
Update 2 11:07 AM: We still haven’t heard from Toyota but Audi and VW did report in the middle of the morning, bringing the total tracked industry sales pace to 17.50mm SAAR by our count. Honda also delivered modest YoY growth in units of about 2.3%. With 70% of the industry now reported, it’s getting less likely that the last third of reporting volume can get the total run-rate above the 17.75mm estimated by analysts.
Update 3 11:26 AM: With results in from Toyota, we have now received February sales numbers from a bit more than 80% of the market. As shown below, with the 7.2% YoY NSA decline Toyota delivered for the month (versus expectations of a 4.8% decline) we are tracking 17.37mm SAAR sales pace on the month.If that number holds, it will be the weakest month of sales since August of 2016.
Update 4 1:48 PM: We now have reports from every significant OEM except for Hyundai and with 95% of the market reported auto sales will miss in February. Despite an incredible 39% YoY spike Mitsubishi sales, weak results from BMW and KIA joined Toyota, Ford, and Fiat-Chrysler in pushing down auto sales. As shown in the bottom chart below, the sales pace has dropped sharply to start 2017 after finishing 2016 on a very high note.
Final Update 3:12 PM: Hyundai reported flat sales YoY taking our final tracking numbers to 17.423mm SAAR with 99.2% of the industry reported. Wards Auto, which conducts their own tracking with a method slightly different from ours, reported a 17.47mm SAAR sales pace based on the numbers reported today by manufacturers. Either way, sales missed solidly and have now declined for 2 months in a row while falling to the lowest level since last August.