Bespoke’s Sector Snapshot — 3/2/17
We’ve just released our weekly Sector Snapshot report (see a sample here) for Bespoke Premium and Bespoke Institutional members. Please log-in here to view the report if you’re already a member. If you’re not yet a subscriber and would like to see the report, please start a 14-day trial to Bespoke Premium now.
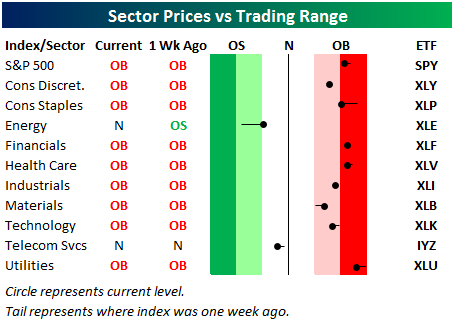
Below is one of the many charts included in this week’s Sector Snapshot, which highlights our trading range screen for the S&P 500 and ten sectors. The black vertical “N” line represents each sector’s 50-day moving average, and as shown, all but two sectors remain solidly above their 50-days. The Energy sector is one of the sectors that’s below its 50-day, but at least it has moved out of oversold territory with a bounce higher this week. (The red zone is considered overbought territory, while the green zone is considered oversold territory.)
To see our full Sector Snapshot with additional commentary plus six pages of charts that include analysis of valuations, breadth, technicals, and relative strength, start a 14-day free trial to our Bespoke Premium package now. Here’s a breakdown of the products you’ll receive.
Bespoke’s Consumer Pulse Report — February 2017
Bespoke’s Consumer Pulse Report is an analysis of a huge consumer survey that we run each month. Our goal with this survey is to track trends across the economic and financial landscape in the US. Using the results from our proprietary monthly survey, we dissect and analyze all of the data and publish the Consumer Pulse Report, which we sell access to on a subscription basis. Sign up for a 30-day free trial to our Bespoke Consumer Pulse subscription service here. With a trial, you’ll get coverage of consumer electronics, social media, streaming media, retail, autos, and much more.

Bloomberg IPO Index Severely Lagging
Learn more about Bespoke’s research and wealth management services.
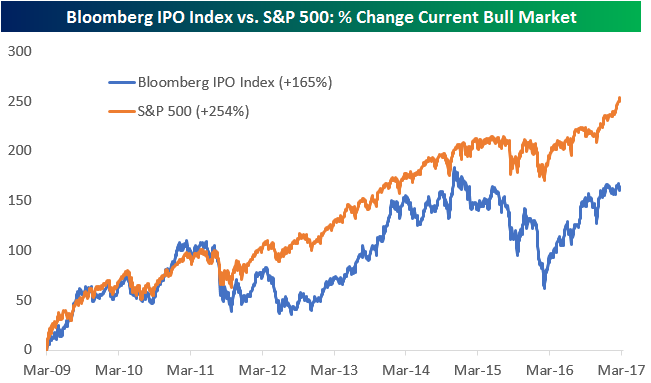
With Snap, Inc. (SNAP) going public today, below is a look at how recent IPOs as a whole have been performing in their first year on the secondary market. The Bloomberg IPO index tracks the performance of first-year IPOs, and below is a chart showing the performing of this IPO index versus the S&P 500 since the start of the current bull market back in March 2009. As shown, while the S&P is up 254%, the IPO index is up nearly 100 percentage points less at +165%. The IPO index has yet to even take out highs put in back in late 2014, while the S&P is well above its levels from that time period.
To see Bespoke’s full line of macro and micro research, sign up for one of our premium membership options today! You won’t be disappointed.
the Bespoke 50 — 3/2/17
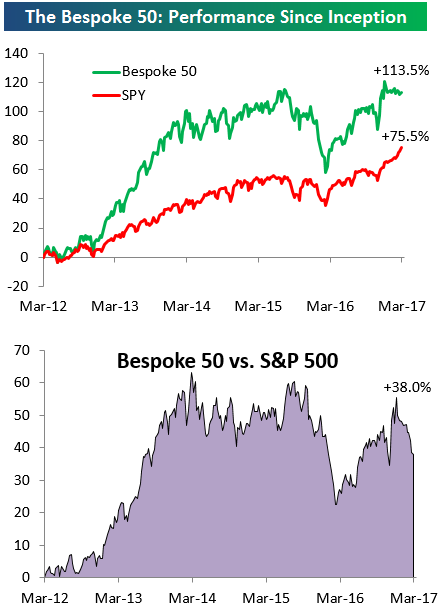
Every Thursday, Bespoke publishes its “Bespoke 50” list of top growth stocks in the Russell 3,000. Our “Bespoke 50” portfolio is made up of the 50 stocks that fit a proprietary growth screen that we created a number of years ago. Since inception in early 2012, the “Bespoke 50” has beaten the S&P 500 by 38 percentage points. Through today, the “Bespoke 50” is up 113.5% since inception versus the S&P 500’s gain of 75,5%.
To view our “Bespoke 50” list of top growth stocks, sign up for Bespoke Premium ($99/month) at this checkout page and get your first month free. This is a great deal!
S&P 500 10-Day A/D Line Moves into Neutral Territory
While equities are currently extended by just about any measure, one indicator of breadth is showing a more neutral picture. The 10-day advance/decline line is an indicator that takes the net number of rising stocks for a given day and adds them all together on a 10-day rolling basis. In the chart below, readings in and above the red-zone indicate that the market is overbought in the short term, while readings in and below the green zone indicate a market that is oversold.
After recently hitting its most overbought levels since the rally following Brexit, the S&P 500’s current 10-day A/D line has seen quite a significant pullback in the last several days — moving into neutral territory. One reason for the decline is due to breadth being relatively narrow in recent days. Take Wednesday for example — even though the S&P 500 had its best day since the day before the election, breadth came in a +323 for the index. Since the election, there have been three other days where the market was up less, but breadth was stronger. Additionally, during the current bull market, on days when the S&P 500 rose 1% or more (as it did on Wednesday), the average daily A/D reading was +394. So while the market continues to sit at or right near all-time highs, breadth has come in a bit.
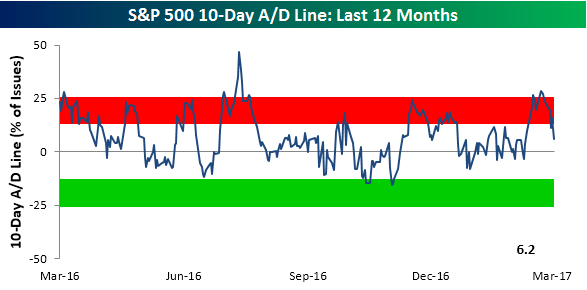
Chart of the Day: Oh SNAP!
Bullish Sentiment Lower: What Else is New?
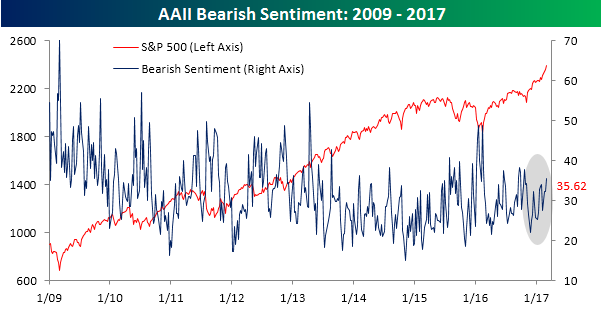
Even though the DJIA just saw its longest streak of daily gains in three decades and US equities had their best day of the year on Wednesday, individual investors still want little to do with the stock market. According to AAII, bullish sentiment for the latest week declined from 38.46% down to 37.91%. This is the seventh straight week that bullish sentiment was below 40%, and a record 113 weeks that bulls have failed to take a majority.

While bullish sentiment declined, bearish sentiment rose up to 35.62%, which is just two percentage points lower than bullish sentiment. Also, as shown in the chart below, bearish sentiment has been steadily trending higher after hitting a seven-month low in late November.
Sixth Best Start to March on Record
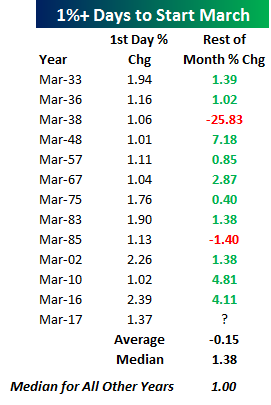
The S&P 500’s 1.37% gain yesterday was the sixth best start to March (1st trading day of the month) in the index’s history. Below is a quick table highlighting all 1%+ gains on the first trading day of March for the S&P 500 since 1928.
You might not remember, but stocks started off last March with a bang as well. The S&P was up 2.39% to start March 2016, and the index went on to gain another 4.11% for the remainder of the month. Prior to last year, 2010 was the last time the S&P gained more than 1% to start March, and just like 2016, the S&P gained another 4%+ for the remainder of the month. Including this year, the S&P has seen gains of 1%+ on the first trading day of March thirteen times (out of 90 years total). In the prior 12 years, the S&P averaged a decline of 0.15% for the remainder of the month. But that average decline is significantly impacted by the 25.8% decline seen for the remainder of March 1938. If you take the median instead of the average, the rest-of-month change is +1.38%. In the 77 other years where the S&P didn’t start March with a 1%+ gain, the index has seen a median rest-of-month gain of 1%.
Jobless Claims Back Down to Levels of the Polaroid Era
Jobless claims saw their largest weekly decline of this short year in the last week, falling from 242K down to 223K. This was the lowest weekly reading since March 1973, the 104th straight week where claims were below 300K, the fifth straight week claims were below 250K, and the seventh time in the nine weeks this year that claims have been lower than expected. Suffice it to say, there’s not much negative to say on the claims front. On the day of Snap’s IPO, it’s ironic to think that the last time claims were this low was when Polaroid was the camera company of the day that was all the rage.
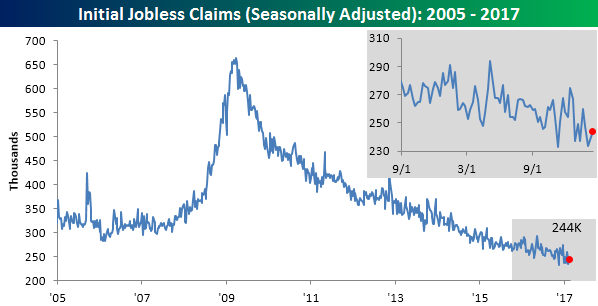
With this week’s decline, the four-week moving average also plunged to a new cycle low of 234.25K. That’s the lowest level for this measure since April 1973.

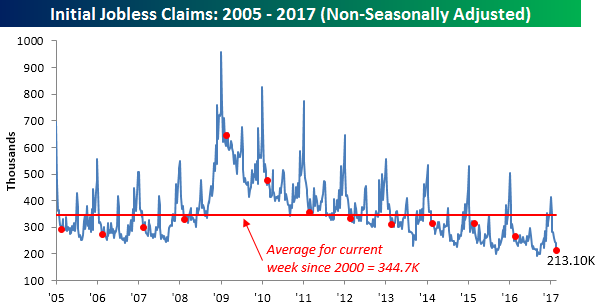
On a non-seasonally adjusted basis, claims were also extraordinarily low, falling to 213.1K. That’s the lowest level for the current week of the year since 1969 and more than 140K below the average of 344.7K for the current week of the year dating back to 2000.
The Closer — The Data Disconnect — 3/1/17
Log-in here if you’re a member with access to the Closer.
Looking for deeper insight on global markets and economics? In tonight’s Closer sent to Bespoke Institutional clients, we take a look at a number of data points released today which paint a very different picture of the economy that “soft” survey-based indicators and financial markets price action.

The Closer is one of our most popular reports, and you can see it and everything else Bespoke publishes by starting a no-obligation 14-day free trial to our research!