Chart of the Day: Stocks Closing At The Highs Less Frequently
ETF Trends: US Sectors & Groups – 3/9/17
European equities continue to outperform over the last five days with Natural Gas the best performing ETF we track despite chaos in the Energy sector more broadly. XES, OIH, XOP, IEO, and XLE all have capitulation-type charts with a huge flush on the 6% decline in front-month WTI yesterday and no recovery visible today. Russia, steel, metals and mining, and commodities more broadly have had a painful run of late.

Bespoke provides Bespoke Premium and Bespoke Institutional members with a daily ETF Trends report that highlights proprietary trend and timing scores for more than 200 widely followed ETFs across all asset classes. If you’re an ETF investor, this daily report is perfect. Sign up below to access today’s ETF Trends report.
See Bespoke’s full daily ETF Trends report by starting a no-obligation free trial to our premium research. Click here to sign up with just your name and email address.
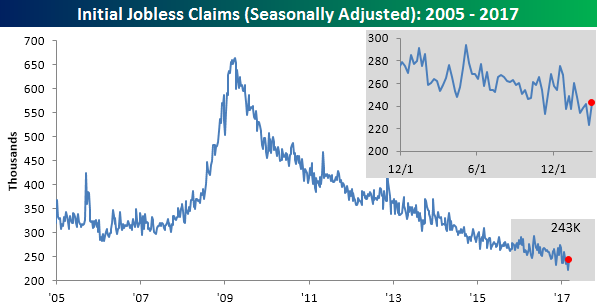
Jobless Claims Rise From Extraordinarily Low Levels
Learn more about Bespoke’s research and wealth management services.
After an absolutely gangbusters initial jobless claims report last week, first-time claims saw a larger than expected increase this week. While economists were expecting first time claims to come in at a level of 238K, the actual reading came in at 243K. While 243K is still very low by historical standards, the 20K increase in claims this week was the largest weekly increase since December. Even still, though, first time claims have been below 300K for 105 straight weeks now and under 250K for six straight weeks.
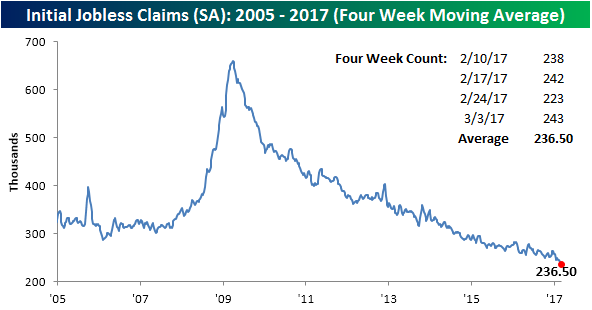
With a 20K increase in claims, the four-week moving average also ticked higher, rising from a multi-decade low of 234.25K last week to 236.5K this week.
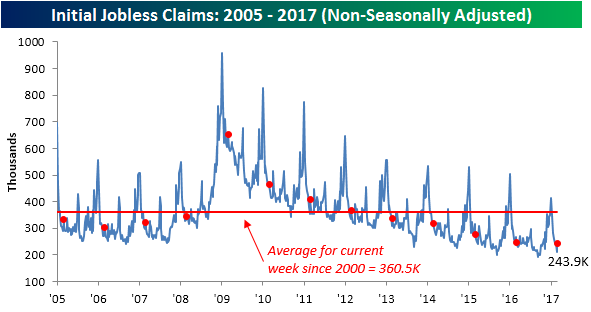
On a non-seasonally adjusted basis, claims rose by 31.1K to 243.9K. For the current week of the year, though, this is the lowest level since 1973 and more than 115K below the average of 360.5K for the current week of the year dating back to 2000.
To see Bespoke’s full line of macro and micro research, sign up for one of our premium membership options today! You won’t be disappointed.
Bespoke’s Sector Trading Range Charts
Learn more about Bespoke’s research and wealth management services.
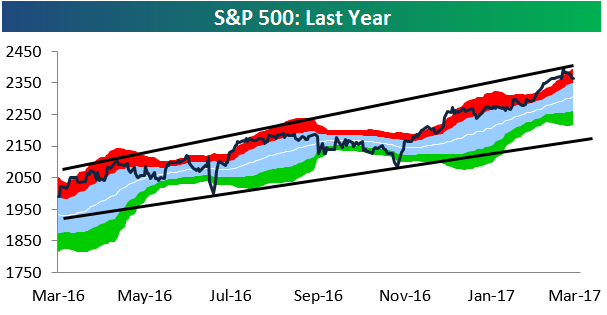
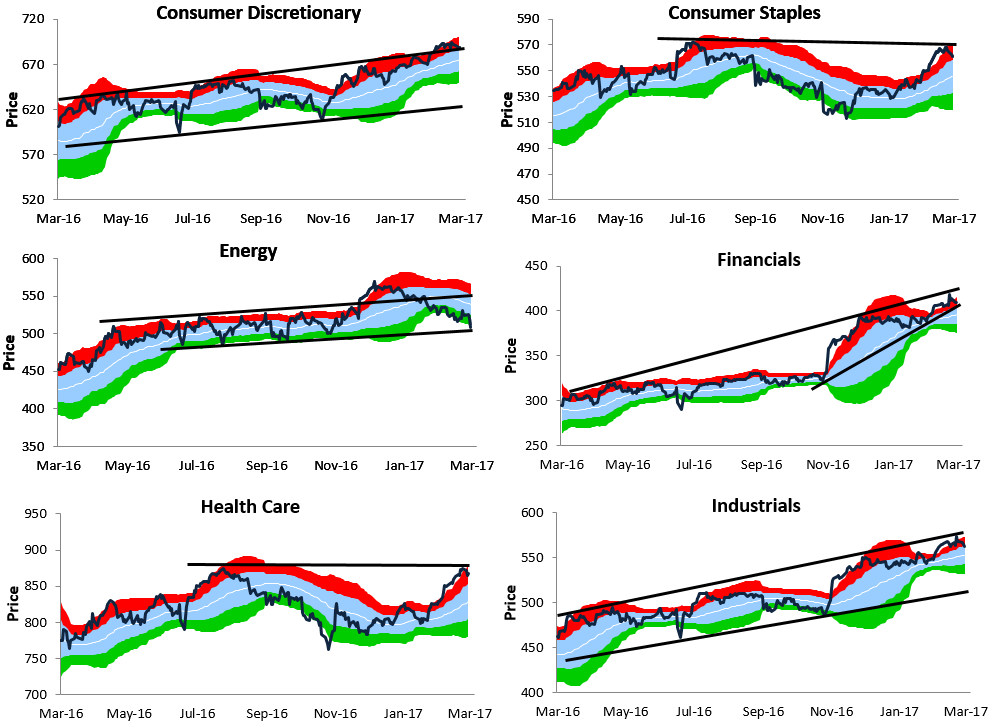
US equity futures are pointed slightly lower once again this morning, and after a week or so of declines, we thought it was a good time to update our S&P 500 sector trading range charts. In the charts below, the white line represents each sector’s 50-day moving average, while the light blue shading represents its “normal” trading range, which is between one standard deviation above and below the 50-day. Moves into the red or green zones are considered “overbought” or “oversold.” The red zone is between one and two standard deviations above the 50-day, while the green zone is between one and two standard deviations below the 50-day.
As shown below, the recent pullback is barely but a blip on the one year chart of the S&P 500. The index remains in a very strong uptrend channel, and it could fall quite significantly and still be trading within its uptrend.
Below is a look at our individual sector trading range charts. Sectors like Financials, Consumer Discretionary, Industrials, Technology, and Materials all look solid still, but a few other sectors have run into some technical problems. Consumer Staples, Health Care, and Utilities all had nice runs up until their recent highs, but all three sectors stalled without being able to take out their highs from mid-2016. Finally, the Energy sector has been the main area of weakness for the market in 2017, and it’s 2.5%+ drop yesterday leaves it right at key support that we’ve drawn on the chart. We’ll see if it can hold support or not in today’s trading.
To see Bespoke’s full line of macro and micro research, sign up for one of our premium membership options today! You won’t be disappointed.
Bespokecast Episode 7 — Helene Meisler — Now Available on iTunes, GooglePlay, Stitcher and More
We’re happy to announce that the newest episode of Bespokecast is now available to the general public both here and via the various podcast platforms. Be sure to subscribe to Bespokecast on your preferred podcast app to gain access to our full collection of episodes. We’d also love for you to provide a review as well!
In our newest conversation on Bespokecast, we speak with renowned technician and market commentator Helene Meisler. Helene has had a long career in financial markets, starting in the early 1980s with Cowen before becoming the only technician on staff at Goldman Sachs in the mid-1980s. She offers a valuable, experienced perspective on markets, trading, and technical analysis. Currently, Helene’s observations are widely followed on Twitter and she writes a daily column at RealMoney.com. We really enjoyed hearing her perspective on the markets and we hope you enjoy the conversation!
Each new episode of our podcast features a special guest to talk markets with, and Bespoke subscribers receive special access before it’s made available to the general public. If you’d like to try out a Bespoke subscription in order to gain access to these podcasts in advance, you can start a two-week free trial to check out our product. To listen to episode 7 or subscribe to the podcast via iTunes, GooglePlay, OvercastFM, or Stitcher, please click below.

This is How Individual Investors Celebrate?
Learn more about Bespoke’s research and wealth management services.
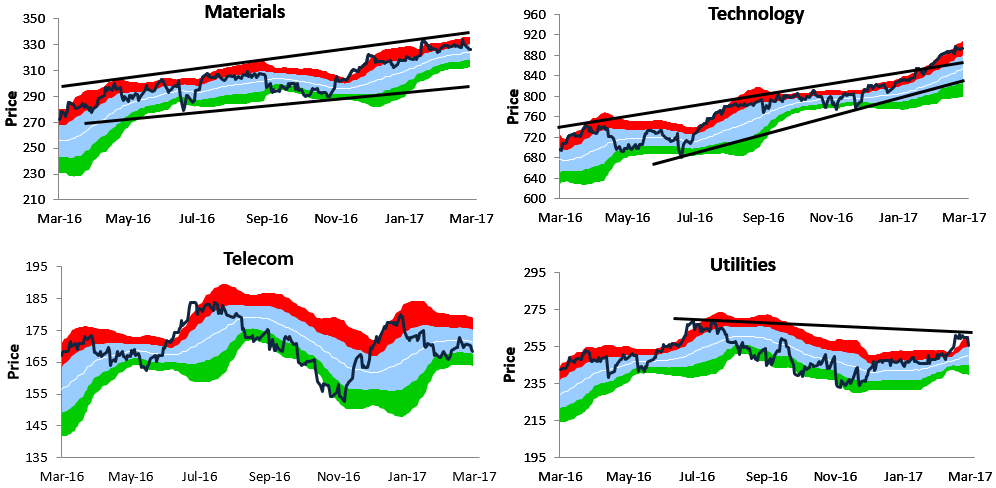
On this eighth anniversary of the bear market lows from 2009 and the start of the most hated bull market in history, it seems only fitting that sentiment gauges of individual investors from AAII came in where they did this week. We’ll start with the percentage of investors who can’t make up their mind and therefore put themselves in the neutral camp. In this week’s survey, that percentage dropped to 23.5%, which is the lowest reading of 2017 and the third lowest reading in the last four years! At the very least, investors appear to finally be taking a stand.
What’s amazing, however, is how few of these investors are willing to commit themselves to the bullish camp. In this week’s survey, bullish sentiment dropped from 37.9% down to 30.0%. That’s the lowest weekly reading in bullish sentiment since the week before the election and also extends the record streak of weeks where bulls haven’t been in the majority to 114!
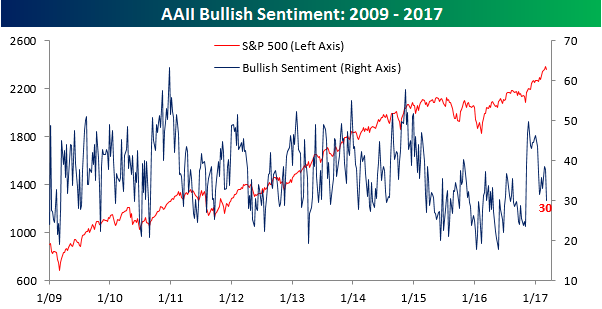
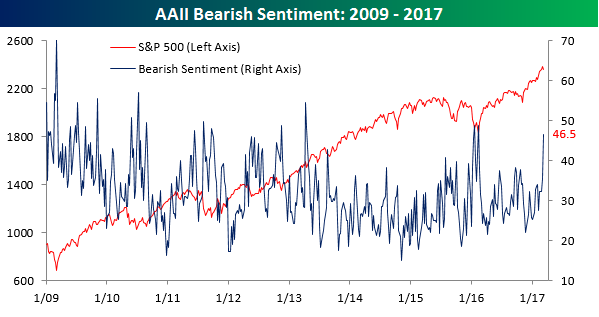
That leaves us with bearish sentiment, which absolutely surged this week. From last week’s level of 35.6%, bears ballooned to 46.5%, which is the highest reading since the equity market lows last February and the 20th highest weekly reading (out of 418 weeks) in bearish sentiment since the start of the bull market in March 2009! Normally, we would say that this doesn’t seem like the best way to commemorate an eight year bull market, but when it’s a bull market that so many individual investors have watched from the sidelines, it makes sense that they aren’t in any mood to celebrate.
To see Bespoke’s full line of macro and micro research, sign up for one of our premium membership options today! You won’t be disappointed.
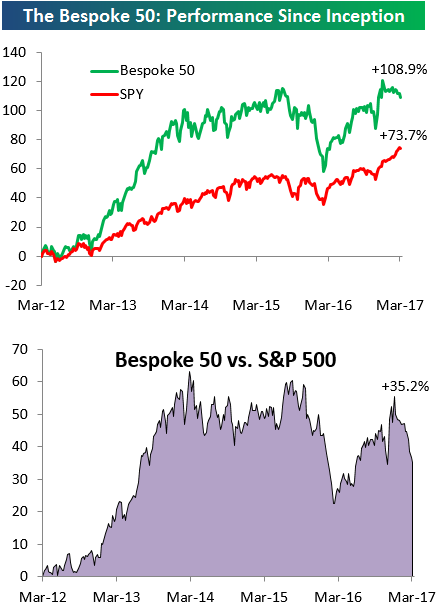
the Bespoke 50 — 3/9/17
Every Thursday, Bespoke publishes its “Bespoke 50” list of top growth stocks in the Russell 3,000. Our “Bespoke 50” portfolio is made up of the 50 stocks that fit a proprietary growth screen that we created a number of years ago. Since inception in early 2012, the “Bespoke 50” has beaten the S&P 500 by 38 percentage points. Through today, the “Bespoke 50” is up 113.5% since inception versus the S&P 500’s gain of 75,5%.
To view our “Bespoke 50” list of top growth stocks, sign up for Bespoke Premium ($99/month) at this checkout page and get your first month free. This is a great deal!
The Closer — ADP Modeled, Crude Collapses — 3/8/17
Log-in here if you’re a member with access to the Closer.
Looking for deeper insight on global markets and economics? In tonight’s Closer sent to Bespoke Institutional clients, we review the monster ADP print from this morning, updated Q4 productivity from the BLS, the US Census’ release of January Wholesaler Sales, and EIA data on petroleum markets that saw a new local high in US crude production last week.

The Closer is one of our most popular reports, and you can see it and everything else Bespoke publishes by starting a no-obligation 14-day free trial to our research!
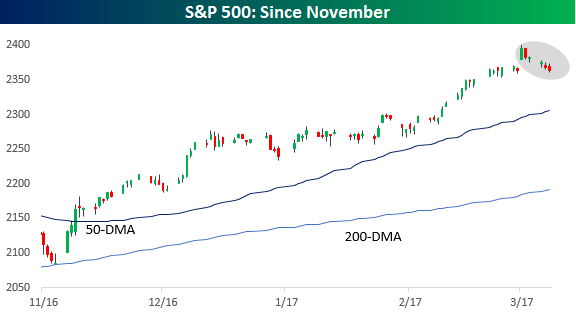
Lower Highs
Learn more about Bespoke’s research and wealth management services.
In a ‘normal’ market, the S&P 500 trading within 1.7% of its all-time high would be nothing to even think about, but when the market goes more than 100 trading days without a 1% decline and goes up seemingly every day, traders who have been spoiled tend to take notice of even minor moves. Everything is relative, so a 1% move in one environment can take on a completely different meaning based on the backdrop.
Along with the S&P 500’s weakness over the last week, one trend that has emerged is that since the day after Trump’s address to Congress when the S&P 500 gapped up to another all-time high, the S&P 500 has seen five straight lower intraday highs. That’s the first time that has happened since just before the election on 11/3. That may sound a bit alarming given the bullish tape we have been in, but in the current bull market alone, we have seen similar streaks of the same length or longer 39 other times, including a streak of ten trading days in March 2011. Following the fifth trading day of those 39 prior streaks, the S&P 500 averaged a gain of 0.76% over the following five trading days with positive returns 59% of the time. That’s more than double the average of all five-day trading day periods (0.31%) during the current bull market.
To see Bespoke’s full line of macro and micro research, sign up for one of our premium membership options today! You won’t be disappointed.