Retail Sales Rest
After a blowout retail sales report for January, this morning’s release for February showed a much more subdued, although still positive, pace of retail sales. On a headline basis, Retail Sales rose 0.1% m/m which was right inline with expectations. Ex Autos and Ex Autos and Gas, today’s report was also right inline with expectations with growth of 0.1% and 0.2%, respectively. Getting back to January’s report, in addition to being considerably better than expected in the initial release, revisions pushed the growth levels even higher, with headline being revised up to 0.6% from 0.4%, and Ex Autos and Ex Autos and Gas both being revised up above 1%.
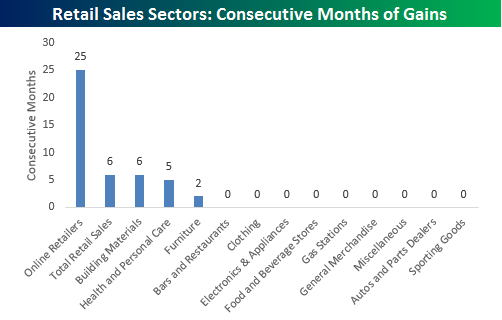
While headline retail sales were uneventful, underneath the service there were some major moves. One of those moves concerns online sales, which have just been sucking up share like a vacuum. As just one example, take a look at the chart below which shows how long each of the thirteen sectors in the Retail Sales report has seen m/m increases. At 25 months and counting, the current streak for online is more than four times as long as the next closest sector Building Materials. Never before in the history of the Retail Sales report (going back to 1993) has any sector seen a similar streak of m/m gains in sales.
For more detailed analysis and coverage of the February retail sales report, sign up for a monthly Bespoke Premium membership now!
Homebuilder Sentiment Soars
Learn more about Bespoke’s research and wealth management services.
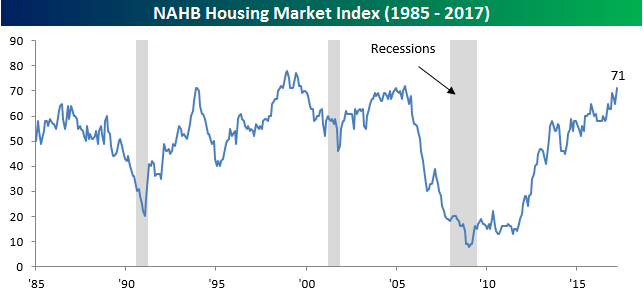
Homebuilder sentiment for the month of March came in significantly stronger than expected this morning, rising to 71 from last month’s level of 65 and expectations for a reading of 65 as well. As shown in the chart below, this month ranks as the highest reading since the height of the housing bubble back in June 2005. Just to illustrate how strong homebuilder sentiment has been in the last few months, going all the way back to 2003, this reading has exceeded expectations by 6+ points just five times and two of those occurrences were in the last four months.
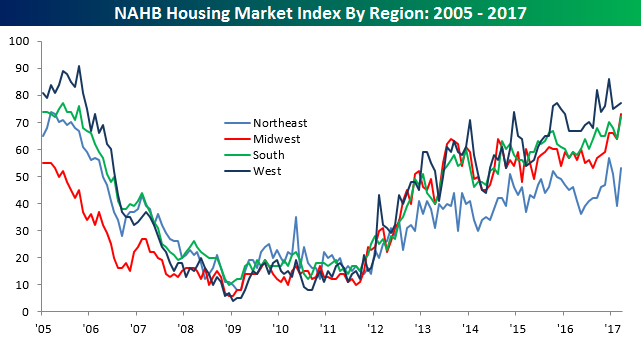
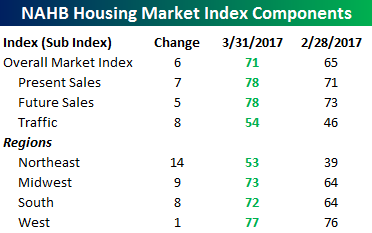 The table to the right breaks down this month’s report by Present and Future Sales, Traffic, and Regions, and no matter what metric you look at. sentiment was more optimistic in March compared to February. Like the headline reading, cycle highs were also seen in every category and region except the Northeast and West. To see Bespoke’s full line of macro and micro research, sign up for one of our premium membership options today! You won’t be disappointed.
Bespoke’s “Industry Insights” Report — Metals & Mining — 3/15/17
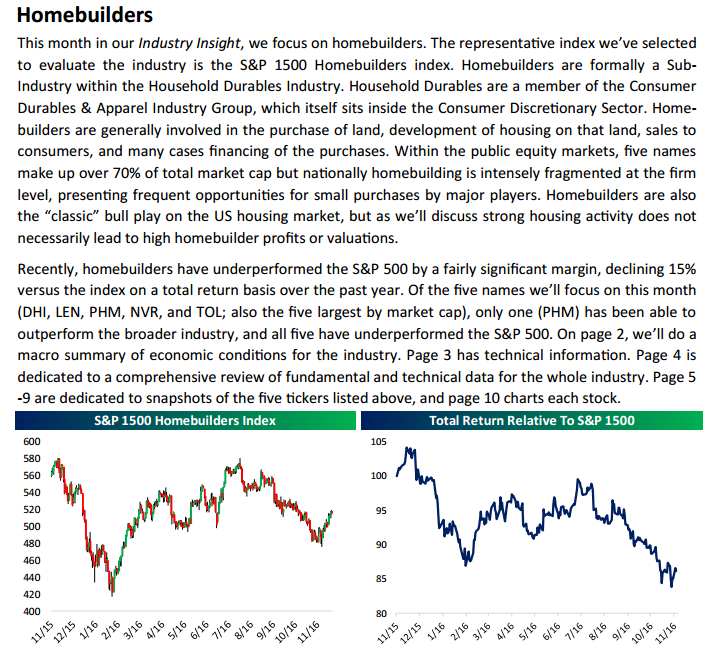
Today we’ve published the third edition of our new “Industry Insights” report that’s available to Bespoke Institutional subscribers. Our “Industry Insights” report provides more in-depth industry/sector/group coverage than we’ve previously offered. In our previous edition, we took a look at Restaurants. This month, we cover the Metals & Mining industry. In addition to a top-down overview of the industry, we also look specifically at FCX (Freeport-McMoRan), CLF (Cliffs Natural Resources), NEM (Newmont Mining), RGLD (Royal Gold), and AA (Alcoa). Over the next few months, we’ll be publishing reports on more industries until we build a pretty extensive coverage list.
Below is a snapshot of the first page from this month’s report. To access the full 11-page PDF, sign up for a two-week free Bespoke research trial today. In addition to this report, you’ll also receive everything else we publish on a daily basis, starting with our Morning Lineup and finishing with The Closer each night.
The Closer — Thematic Theories, Vapid Volatility, PPI Punchy — 3/14/17
Log-in here if you’re a member with access to the Closer.
Looking for deeper insight on global markets and economics? In tonight’s Closer sent to Bespoke Institutional clients, we look at relative performance of various US equity market themes, spend a couple pages charting recent volatility themes, and dissect this month’s PPI report.

The Closer is one of our most popular reports, and you can sign up for a free trial below to see it!
The Closer is one of our most popular reports, and you can see it and everything else Bespoke publishes by starting a no-obligation 14-day free trial to our research!
Chart of the Day – Problems Problems Problems
B.I.G. Tips – March Fed Days
ETF Trends: US Indices & Styles – 3/14/17
International equities continue to outperform with 6 of the top 9 ETFs over the last 5 days (among the universe we track) representing country indices. Gold miners, natural gas, biotech, and health care have also outpeformed. The biggest declines have come from Energy and crude oil, with 9 of the 10 worst performing ETFs we tracking representing oil or oil-related sectors.

Bespoke provides Bespoke Premium and Bespoke Institutional members with a daily ETF Trends report that highlights proprietary trend and timing scores for more than 200 widely followed ETFs across all asset classes. If you’re an ETF investor, this daily report is perfect. Sign up below to access today’s ETF Trends report.
See Bespoke’s full daily ETF Trends report by starting a no-obligation free trial to our premium research. Click here to sign up with just your name and email address.
Bespoke Stock Scores: 3/14/17
Small Business Owners Still Optimistic
Learn more about Bespoke’s research and wealth management services.
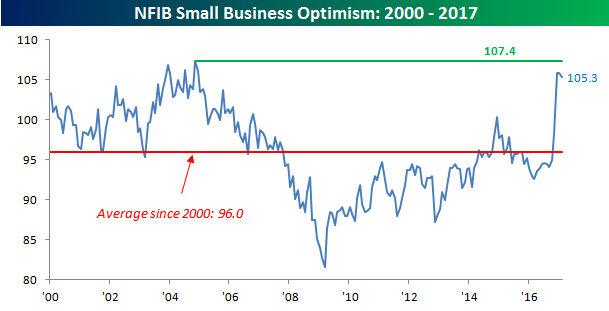
Today’s release of the NFIB Small Business Optimism Report showed a slightly larger than expected downtick in overall optimism. With economists collectively expecting the overall index to decline from 105.8 down to 105.6, the actual reading came in at 105.3. Despite the larger than expected decline, overall optimism is much higher than where it was just a few months ago, well above its average level of 96.0 dating back to 2000, and also right near its cycle highs. So from an economic perspective, it’s hard to get too disappointed with this reading. That said, while optimism remains solid, as the NFIB stated in the report, “Optimism has not faded, but the enthusiasm has yet to be translated into an equally impressive increase in spending and hiring. This will require progress on the agenda that business owners voted for.”
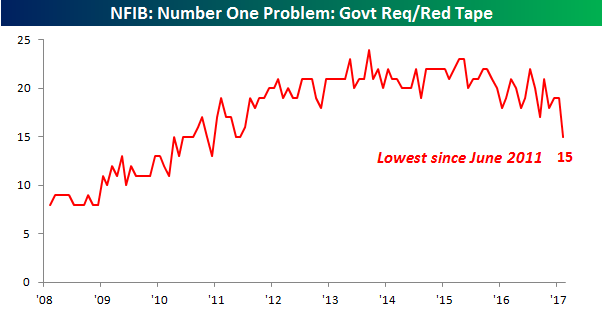
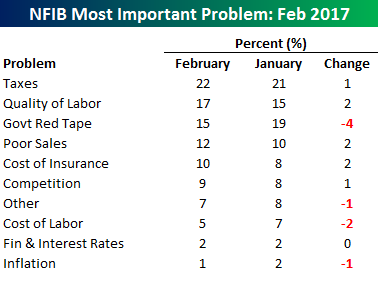 Within each month’s survey, the NFIB asks small business owners what the number one problem is that they face in running their businesses. In this month’s data, we saw a lot of sizable changes. For the first time in a long time, Taxes and Government Red Tape are not the two top problems cited. Taxes remain at the top with 22% of small businesses citing it as their number one problem, but Govt Red Tape saw a sharp drop in the percentage of businesses that cited it as their number one problem, falling from 19% down to 15%. At the same time, Labor Quality moved up two percentage points from 15% to 17%. In terms of Labor, the increase of businesses citing Labor Quality as their number one problem could ultimately lead to increased labor costs down the road as business owners are forced to pay up for better workers. That didn’t show up in this month’s report, though, as Cost of Labor was actually only cited by 5% of small business owners as their number one problem, which was down from 7% in January.
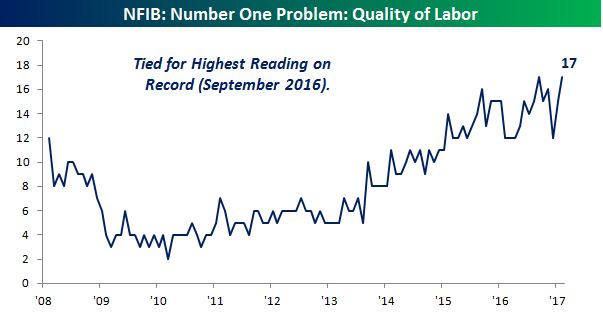
The charts below show the change over time in the percentage of small businesses that cited Quality of Labor and Government Red Tape as their number one problems. In the case of Quality of Labor, this month’s reading of 17% is tied for the highest reading in the history of the survey going back to 2008. Meanwhile, the 15% of small business owners that cited Government Red Tape as their number one problem dropped down to its lowest level since June 2011. It’s amazing what a changed tone out of Washington can do for sentiment.
To see Bespoke’s full line of macro and micro research, sign up for one of our premium membership options today! You won’t be disappointed.
The Closer — Canadian Confidence, Commodity Breadth — 3/13/17
Log-in here if you’re a member with access to the Closer.
Looking for deeper insight on global markets and economics? In tonight’s Closer sent to Bespoke Institutional clients, we chart up improving consumer confidence north of the border. We also take a look at breadth within Bloomberg’s Commodity Index.
The Closer is one of our most popular reports, and you can sign up for a free trial below to see it!
The Closer is one of our most popular reports, and you can see it and everything else Bespoke publishes by starting a no-obligation 14-day free trial to our research!