The Closer 3/17/17 – End of Week Charts
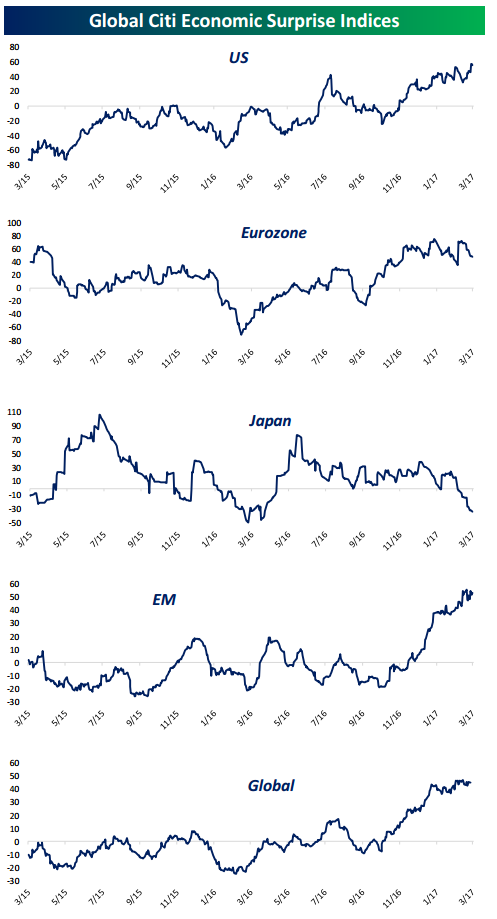
Looking for deeper insight on global markets and economics? In tonight’s Closer sent to Bespoke clients, we recap weekly price action in major asset classes, update economic surprise index data for major economies, chart the weekly Commitment of Traders report from the CFTC, and provide our normal nightly update on ETF performance, volume and price movers, and the Bespoke Market Timing Model.
The Closer is one of our most popular reports, and you can sign up for a free trial below to see it!
Click here to start your no-obligation two-week free Bespoke research trial now!
Bespoke’s Quick-View Chart Book — 3/17/17
“Low Energy” Amazon
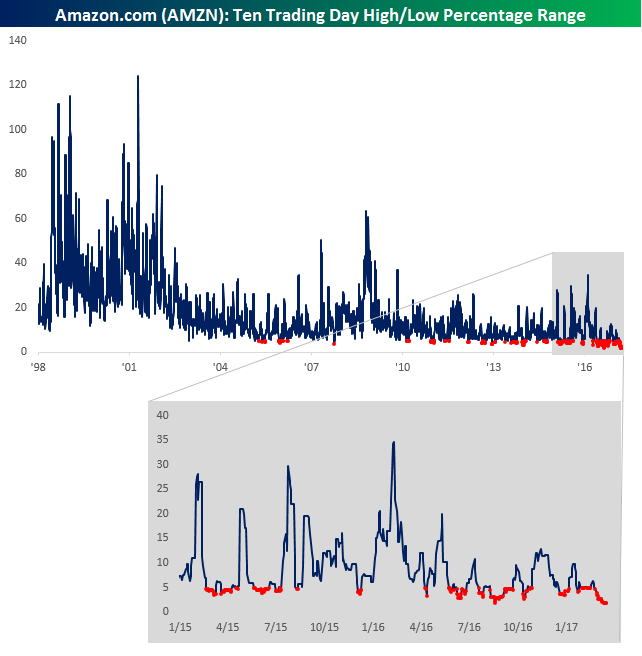
Remember when shares of Amazon.com (AMZN) used to be volatile? It used to be that if you wanted to try and catch a big move in a stock over a short period of time, shares of Amazon.com (AMZN) were a go to name. Over the years, fortunes have been made and lost in short periods of time by traders going long or short AMZN stock. When it first came public, it wasn’t uncommon for AMZN to trade in a 100% range over a two-week period. Even ten years after AMZN IPO’d, its average ten trading day range was just under 15%. That’s practically unheard of for a large cap stock! Just like a hyper puppy eventually turns into a lazy dog, though, AMZN’s stock has really entered a period of decreased volatility.
The chart below shows the rolling ten trading day range in AMZN’s share price from the time it came public up until now. We have also included red dots to show each time the ten trading day range dropped below 5%. In AMZN’s first decade as a public company, there were only three clusters of time where the stock traded in a sub-5% trading range and that accounted for just 1% of all trading days. In the company’s second decade as a public company, however, the frequency of sub 5% readings in the stock’s ten trading day range has increased ten-fold to more than 11% off all occurrences. More recently, AMZN has become even less volatile. Last August, the stock traded in its narrowest two-week trading range on record (1.92%), and just this week traded in its second narrowest range ever to 1.93%. Additionally, provided the stock doesn’t trade above $859.80 or below $843.75 between now and Monday’s close, this will go down as AMZN’s narrowest ten trading range on record.
Early Cycle Pattern For Philly Fed
 One typical characteristic about a rally early on in a market or economic cycle is that breadth is extremely positive. Following a deep and prolonged downturn in the market or the economy, things get so beat down that any improvement tends to lift all or most boats early on. Then, the deeper you get into the cycle, the thinner breadth becomes as certain sectors start to fade. In this regard, when the market or economy peaks, breadth usually shows signs of narrowing before the actual high.
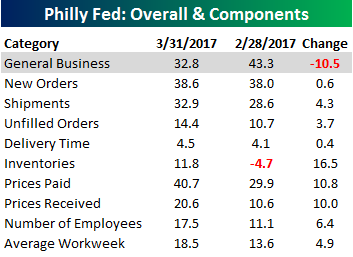
That’s what makes yesterday’s release of the Philly Fed Manufacturing report for March so interesting. While the headline index showing General Business Conditions declined m/m following February’s surge to the 30+ year high, all nine of the report’s sub-indices showed m/m gains. That’s a rare trend. To illustrate, going back to 1980, there have only been three other monthly reports where the index of General Business Conditions declined m/m, but every other sub-index increased. Those occurrences were in May and September of 1996 and December 2003.
In a B.I.G. Tips report sent out to subscribers earlier, we summarized the results of an analysis we did of prior periods where, like the current period, breadth in the Philly Fed report has been strong for multiple months in a row. Even more interesting than where these prior periods occurred during the economic cycle was how the equity market performed in the months after these prior periods of broad strength. To see the results of this insightful analysis, sign up for a monthly Bespoke Premium membership now!
ETF Trends: International – 3/17/17
Only 5 of the more than 200 ETFs we track were down by more than 1% over the past week. Only 12 were down more than 50 bps. Of those, banks, USD, and biotech feature prominently. The best performers are metals and mining stocks and EM country ETFs.

Bespoke provides Bespoke Premium and Bespoke Institutional members with a daily ETF Trends report that highlights proprietary trend and timing scores for more than 200 widely followed ETFs across all asset classes. If you’re an ETF investor, this daily report is perfect. Sign up below to access today’s ETF Trends report.
See Bespoke’s full daily ETF Trends report by starting a no-obligation free trial to our premium research. Click here to sign up with just your name and email address.
The Closer — China, Capital, Construction, Comfort, Quits, Curves — 3/16/17
Log-in here if you’re a member with access to the Closer.
Looking for deeper insight on global markets and economics? In tonight’s Closer sent to Bespoke Institutional clients, we hit all the bases. First up is a look at home prices in major global metros as they look to Chinese investors: denominated in Chinese yuan. Next, we take a look at what the new high in Bloomberg’s Consumer Comfort index means for stock prices. We recap US Census data on residential construction, US Treasury data on international capital flows, and BLS data on job openings. Finally, we take a look at big technical levels for the UST yield curve and emerging market equities.

The Closer is one of our most popular reports, and you can sign up for a free trial below to see it!
The Closer is one of our most popular reports, and you can see it and everything else Bespoke publishes by starting a no-obligation 14-day free trial to our research!
Bespoke’s Sector Snapshot — 3/16/17
We’ve just released our weekly Sector Snapshot report (see a sample here) for Bespoke Premium and Bespoke Institutional members. Please log-in here to view the report if you’re already a member. If you’re not yet a subscriber and would like to see the report, please start a 14-day trial to Bespoke Premium now.
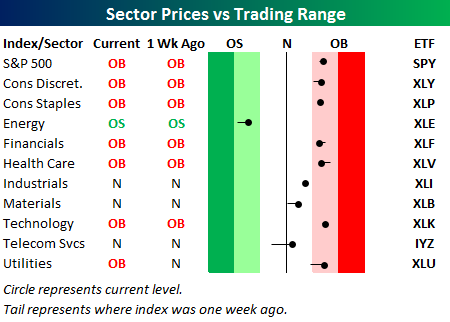
Below is one of the many charts included in this week’s Sector Snapshot, which highlights our trading range screen for the S&P 500 and ten sectors. The black vertical “N” line represents each sector’s 50-day moving average, and as shown, the Energy sector is the only one currently below its 50-day. Conversely, the S&P 500 and six sectors are trading in overbought territory. (The red zone is considered overbought territory, while the green zone is considered oversold territory.)
To see our full Sector Snapshot with additional commentary plus six pages of charts that include analysis of valuations, breadth, technicals, and relative strength, start a 14-day free trial to our Bespoke Premium package now. Here’s a breakdown of the products you’ll receive.
Years Like 2017: March Edition
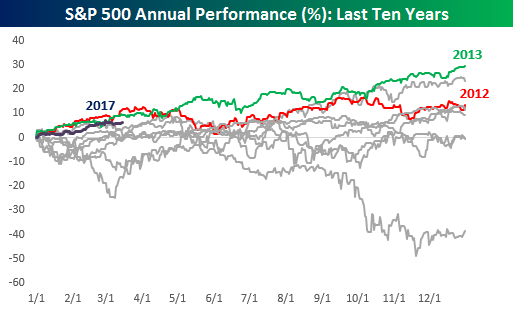 It’s hard to believe that we’re already fifty trading days into the year, meaning that 2017 is already just about 20% in the books. The best way to characterize 2017? We’d say “so far, so good.” With a gain of 6.5%, 2017 ranks as the third best start to a year in the last ten years, behind both 2012 and 2013, and in both of those years, the index finished the year higher than it was on 3/15. Today, we wanted to take this one step further and look at past years that started off looking the most similar to 2017.
To that end, as we do throughout the year, we analyzed years where the S&P 500’s closing prices had the greatest correlation to the closing prices so far in 2017. Then, for each year, we provided a summary including the correlation coefficient between closing prices for that year to the S&P 500 YTD through 3/15, how the S&P 500 performed YTD in each year through 3/15, and then how the index performed over the remainder of the year, including maximum gains and losses from the 3/15 closing level.
While history doesn’t always repeat itself exactly, patterns in the market have a way of repeating themselves, which makes this analysis extremely interesting as well as useful. To see the report, sign up for a monthly Bespoke Premium membership now!
Jobless Claims Inline; Still Low
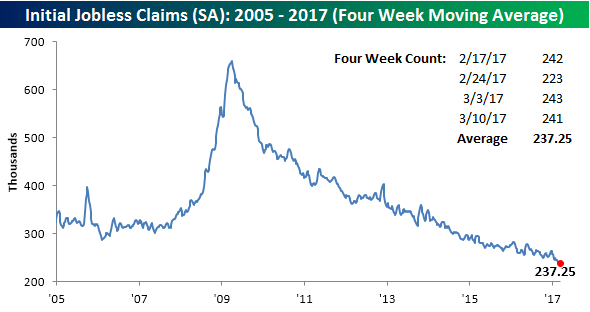
Remember back in 2014 when jobless claims first crossed below 300K and it was considered a major deal? These days, not so much. Not only is sub-300K expected, but sub-250K has now become the norm. In the latest week, first-time claims dropped by 2K down to 241K, which was pretty much right in line with consensus expectations for a reading of 240K. With this week’s print, jobless claims have been below 300K for 106 straight weeks and below 250K for seven. Things continue to look solid in the labor market.

Although weekly claims dropped slightly, the four-week moving average increased from 236.5K up to 237.25K, which is just 3K above the current cycle low of 234.25K from three weeks ago.
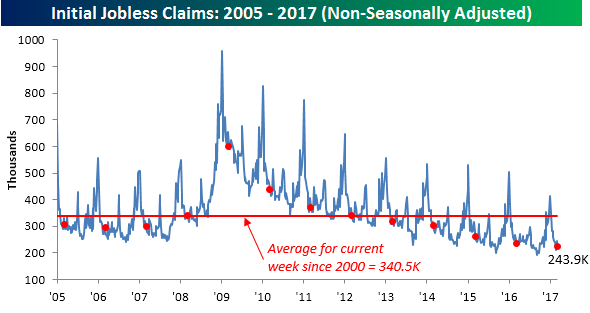
On a non-seasonally adjusted basis, jobless claims fell by 21.5K down to 222.5K. For the current week of the year, you have to go back to 1969 to find a lower reading. Additionally, since 2000, the average for the current week of the year is nearly 120K higher (340.5K).
Philly Fed Retreats But Still Ahead of Estimates
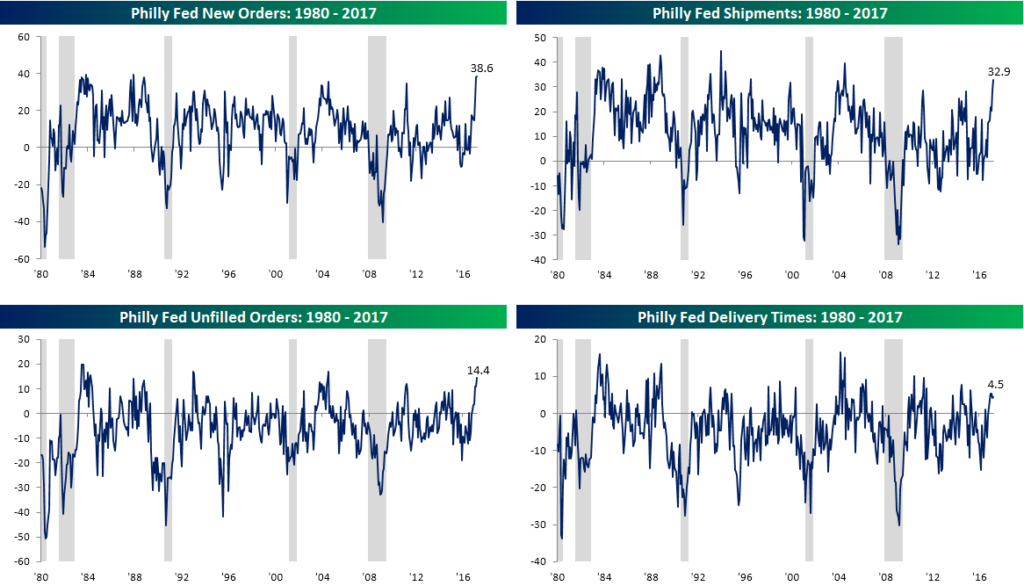
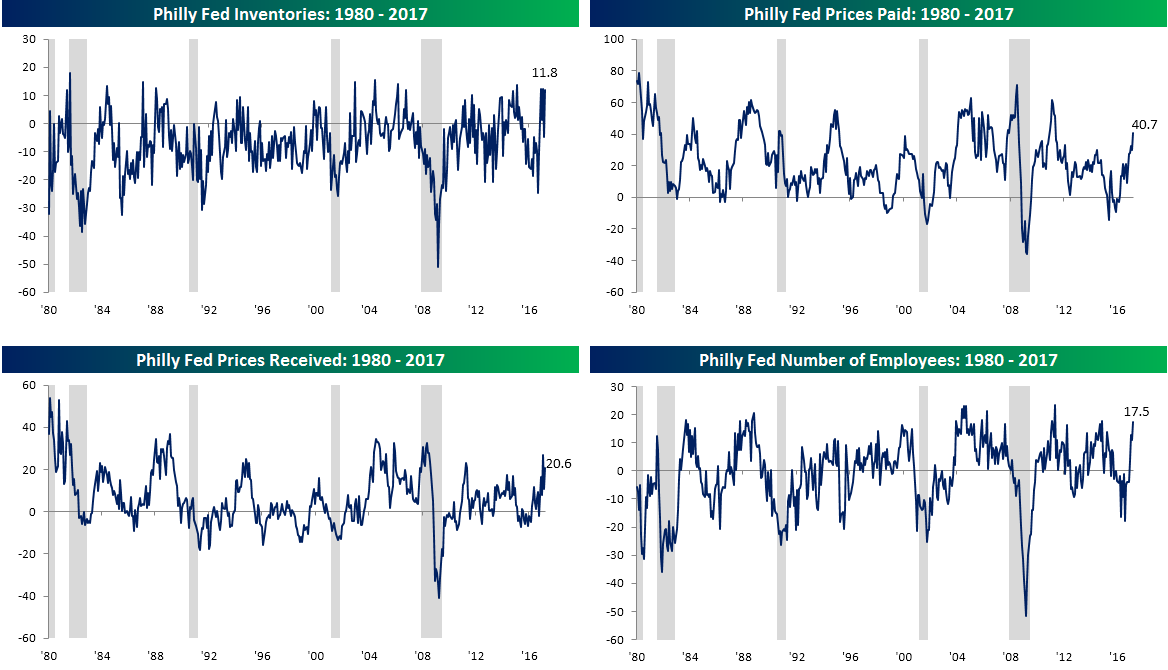
After an insanely positive increase in last month’s headline index, the Philly Fed Manufacturing Index of Current Business Conditions retreated this month but still managed to beat expectations. While economists were expecting the headline indices to retreat from a multi-decade high of 43.3 down to 25.0, the actual decline was smaller at 10.5 points, bringing the index down to 32.8. To put this in perspective, outside of last month’s blowout reading, the current level would still have been the highest reading since November 2014.
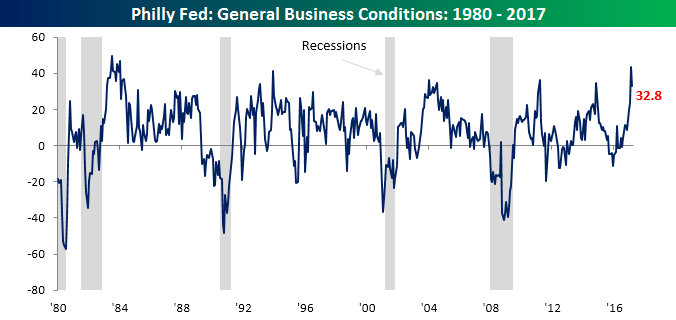
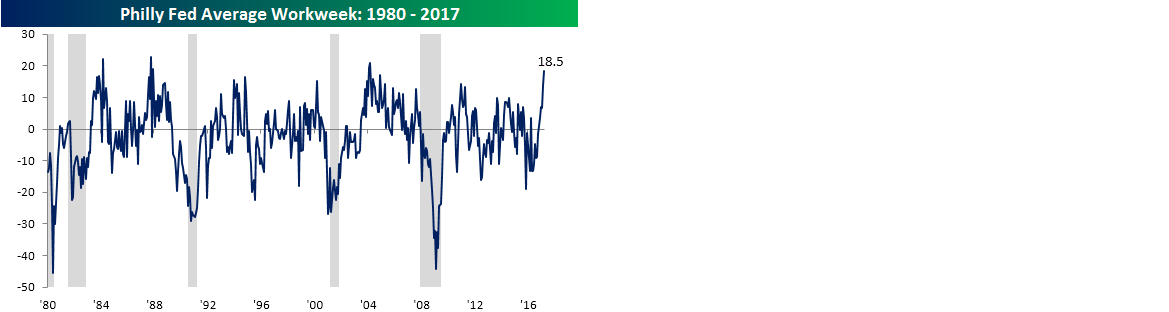
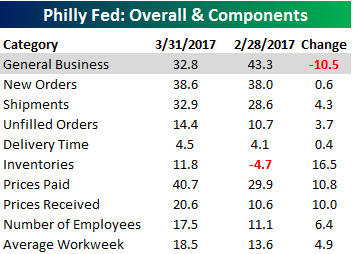 Although the headline index declined this month, every one of the index’s sub-components saw a m/m increase in March. Going back to 1980, there have only been three other months where the General Business Conditions Index declined, but every other component rose. Those occurrences were in May and September of 1996 and December 2003. In order to see just how much things have changed in the last few months regarding the Philly Fed report, below we have charted each of the individual components listed in the table. Yes, it is ‘soft’ data, but there has been a virtual sea change in sentiment.