Bespokecast — Episode 8 — PJ Gorynski
 In our newest conversation on Bespokecast, we speak with Bespoke Market Intelligence co-founder PJ Gorynski. PJ runs Bespoke’s primary research business, conducting consumer and business surveys for institutional clients that offer insight into the trends and drivers of businesses. In our wide-ranging conversation, we discuss how clients use Bespoke’s survey data to see deeper into business models, also discussing the state of the hedge fund industry and specific names covered in PJ’s research including Chipotle (CMG), GameStop (GME), Snapchat (SNAP), and Volkswagen (VLKAY). The Queens native also gives us some insight into the best pizza in New York and the agony of New York Mets fandom. We hope you enjoy the conversation!
To access episode 8 immediately, please start a 14-day free trial to Bespoke’s research product. If you’ve already signed up for a Bespoke free trial in the past, you can gain access by choosing a membership option at our products page. Here’s a look at past guests if you’re interested.

Bespoke’s Sector Snapshot — 3/23/17
We’ve just released our weekly Sector Snapshot report (see a sample here) for Bespoke Premium and Bespoke Institutional members. Please log-in here to view the report if you’re already a member. If you’re not yet a subscriber and would like to see the report, please start a 14-day trial to Bespoke Premium now.
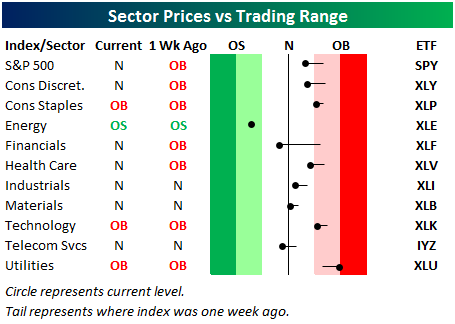
Below is one of the many charts included in this week’s Sector Snapshot, which highlights our trading range screen for the S&P 500 and ten sectors. The black vertical “N” line represents each sector’s 50-day moving average, and as shown, three sectors — Energy, Financials, and Telecom — are now below their 50-days. Only three sectors — Consumer Staples, Technology, and Utilities — remain overbought. (The red zone is considered overbought territory, while the green zone is considered oversold territory.)
To see our full Sector Snapshot with additional commentary plus six pages of charts that include analysis of valuations, breadth, technicals, and relative strength, start a 14-day free trial to our Bespoke Premium package now. Here’s a breakdown of the products you’ll receive.
ETF Trends: US Sectors & Groups – 3/23/17
Treasuries continued to gain, with Mexico, gold, and Japanese yen also rallying. Stronger yen means weaker equity prices in Japan most of the time, helping to push DXJ down. Banks and brokers are all over the top of the list of worst performers, with solar, steel, and oil stocks also in pain.

Bespoke provides Bespoke Premium and Bespoke Institutional members with a daily ETF Trends report that highlights proprietary trend and timing scores for more than 200 widely followed ETFs across all asset classes. If you’re an ETF investor, this daily report is perfect. Sign up below to access today’s ETF Trends report.
See Bespoke’s full daily ETF Trends report by starting a no-obligation free trial to our premium research. Click here to sign up with just your name and email address.
the Bespoke 50 — 3/23/17
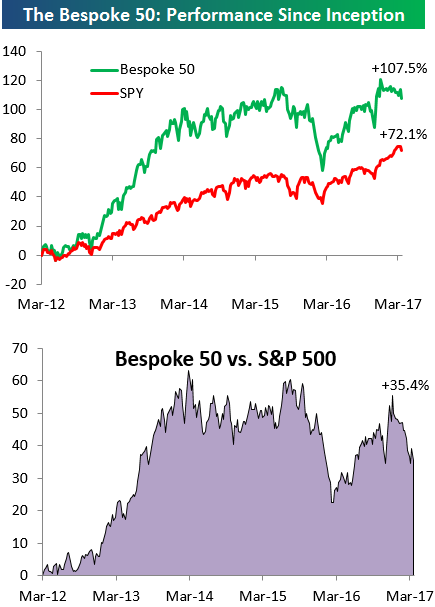
Every Thursday, Bespoke publishes its “Bespoke 50” list of top growth stocks in the Russell 3,000. Our “Bespoke 50” portfolio is made up of the 50 stocks that fit a proprietary growth screen that we created a number of years ago. Since inception in early 2012, the “Bespoke 50” has beaten the S&P 500 by 35 percentage points. Through today, the “Bespoke 50” is up 107.5% since inception versus the S&P 500’s gain of 72.1%. Always remember, though, that past performance is no guarantee of future returns.
To view our “Bespoke 50” list of top growth stocks, sign up for Bespoke Premium ($99/month) at this checkout page and get your first month free. This is a great deal!
Individual Investors Buying on Weakness
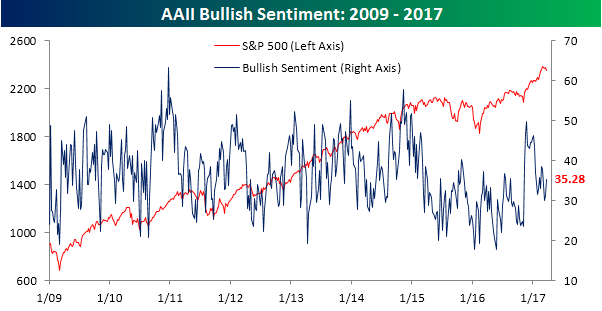
With bulls failing to reach a majority in the weekly AAII sentiment poll for a record 116 straight weeks, one would think that the sell-off earlier this week would have sent bullish investors scrambling like a bunch of cockroaches. The reality was somewhat different, though. In this week’s survey, bullish sentiment actually ticked higher, rising from 31.17% up to 35.28%. True, that’s barely even a third of the total, but given the fragile state of investor sentiment, it is not what we would have expected.
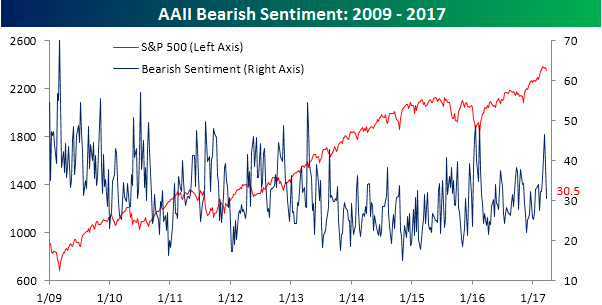
Bearish sentiment saw an even larger move in the opposite direction. As shown in the chart below, bearish sentiment declined from 38.7% down to 30.5%. That’s the lowest weekly reading since early February, the largest one-week decline since early October, and the largest two-week decline since February 2016. That’s quite a thaw in the bearish camp!
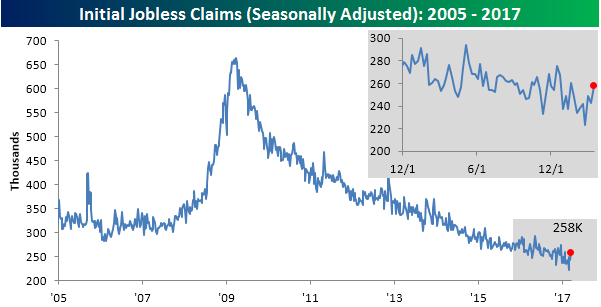
Jobless Claims ‘Spike’
When it comes to weekly jobless claims reports these days, everything is relative. Therefore, after seven straight weeks where jobless claims came in below 250K and 106 straight weeks where claims were below 300K, a weekly increase of 15K is a relatively big move. In this week’s report, claims rose from 243K up to 258K. That’s 18K above the consensus estimate and the highest weekly print since January 20th.
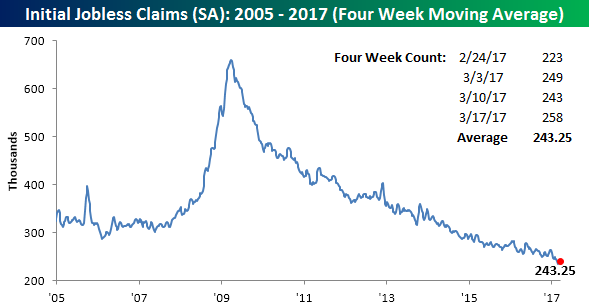
With this week’s ‘spike’ in claims, the four-week moving average ticked up by 4K to 243.25K, which is the highest reading for this measure since 2/10.
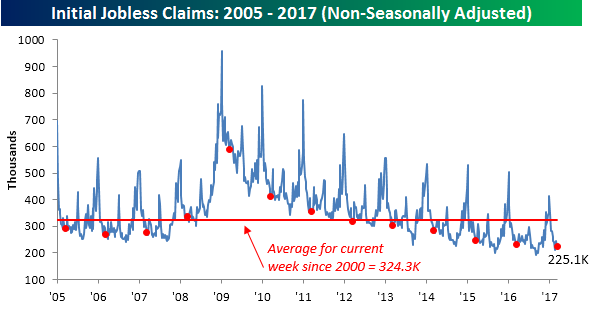
On a non-seasonally adjusted basis, jobless claims increased by less than 3K to 225.1K. For the current week of the year, that’s below the average of 324.3K going back to 2000 and the lowest print since 1973.
B.I.G. Tips – Analyzing the March Pullback
The Closer — AHCA Game Theory — 3/22/17
Log-in here if you’re a member with access to the Closer.
Looking for deeper insight on global markets and economics? In tonight’s Closer sent to Bespoke Institutional clients, we apply some game theory to get an idea of what might happen in the AHCA bill vote tomorrow. We also discuss existing home sales data updated today.

The Closer is one of our most popular reports, and you can sign up for a free trial below to see it!
The Closer is one of our most popular reports, and you can see it and everything else Bespoke publishes by starting a no-obligation 14-day free trial to our research!
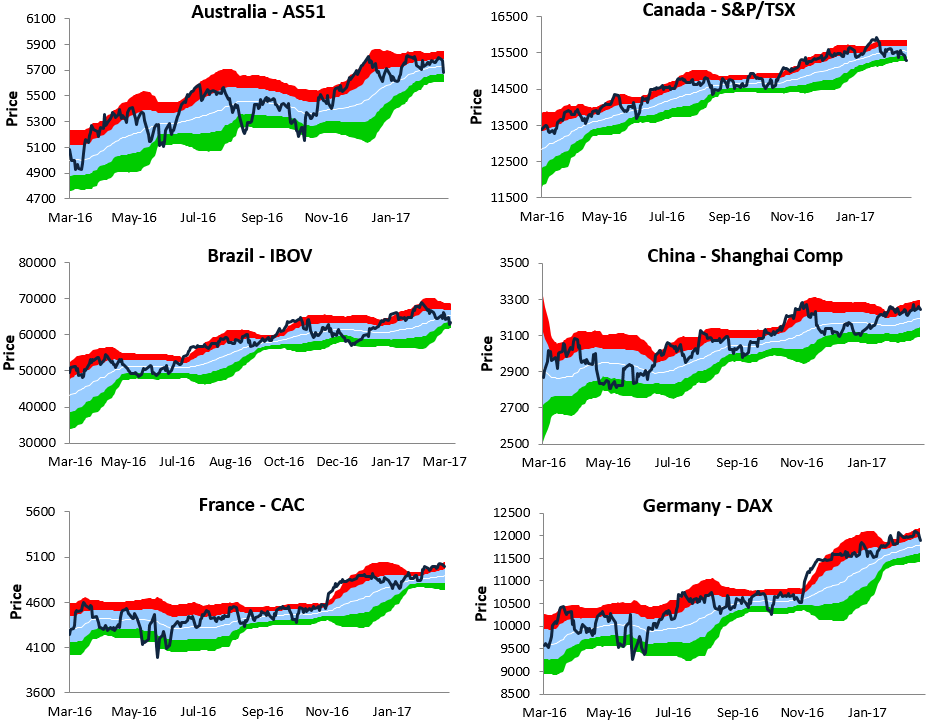
Country Stock Market Trading Range Charts
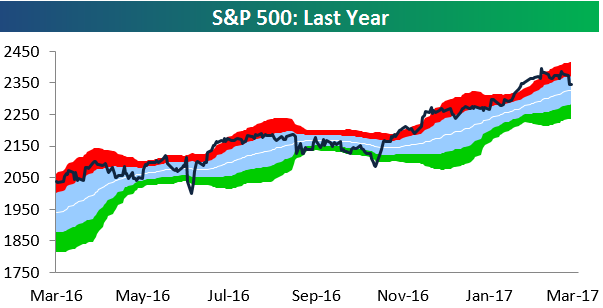
Below is a look at our one-year trading range chart for the S&P 500. The dark blue line represents the index’s price, while the white line represents its 50-day moving average. The light blue shaded area represents the index’s normal trading range, which is one standard deviation above and below the 50-day. The red zone represents between one and two standard deviations above the 50-day, and any move into or above the red zone is considered “overbought.” The green zone represents between one and two standard deviations below the 50-day, and any move into or below the green zone is considered “oversold.”
As you can see in the chart below, the S&P just moved out of overbought territory back into the neutral zone for the first time in months. However, the index remains above its 50-day and within its long-term uptrend channel.
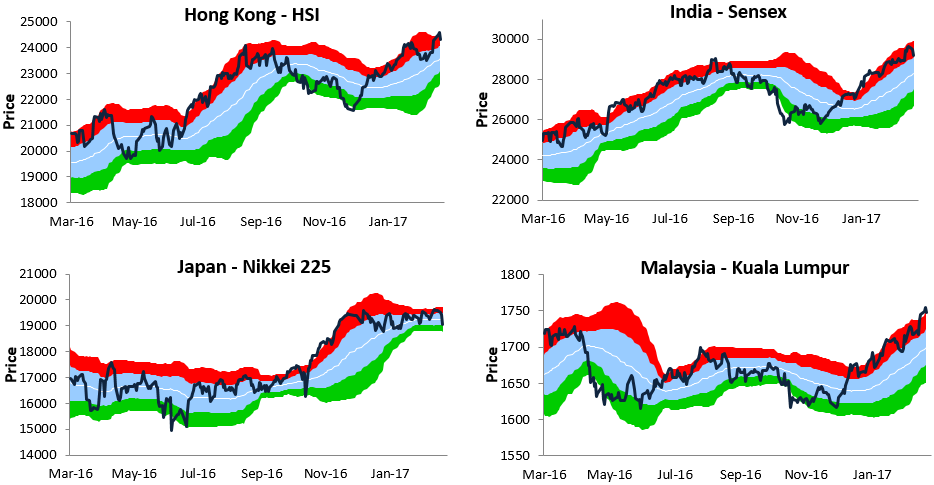
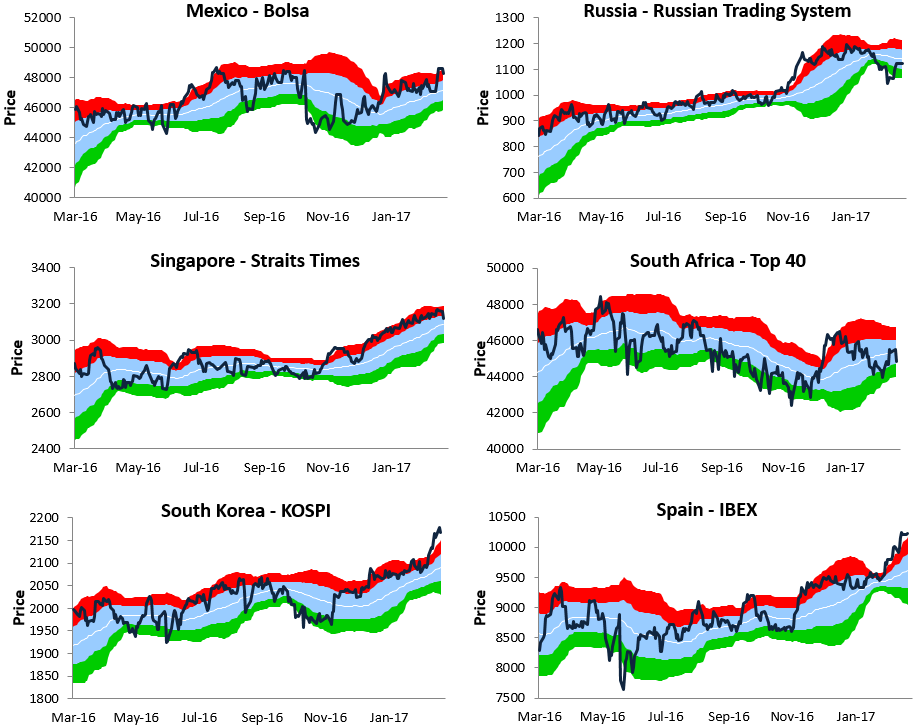
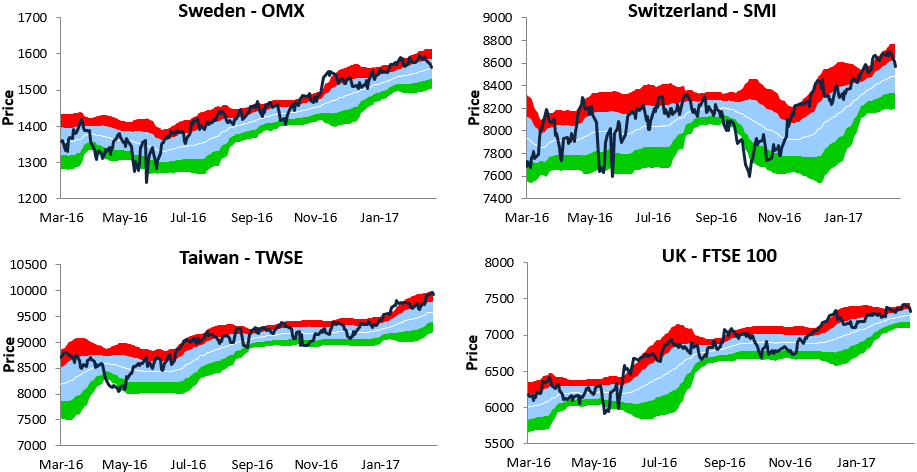
Below we provide one-year trading range charts of major stock market indices for 20 countries around the globe. Like the US, nearly all countries are trading in strong uptrend channels.
Countries that are in uptrends that have recently pulled back to the bottom of their uptrend channels include Canada, Brazil, Russia, Sweden, and the UK. If they can hold support here, they become attractive from a timing perspective.
Countries like Hong Kong, Malaysia, India, South Korea, Spain, and Taiwan are in uptrends as well, but they’re still at extreme overbought levels. It’s best to wait for some mean reversion to occur for these countries.
Like our trading range charts? See them for additional countries, indices, sectors, and stocks by becoming a Bespoke research subscriber today!