The Bespoke Report — 3/24/17
Bespoke’s Quick-View Chart Book — 3/24/17
Best Performing US Stocks So Far in 2017
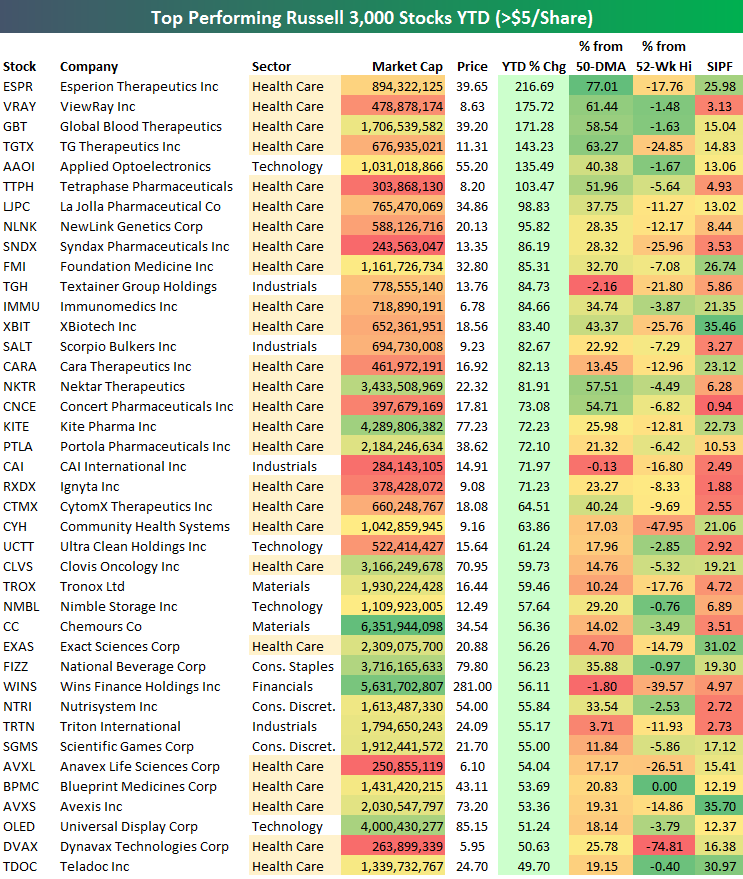
Below is a list of the 40 best performing stocks in the Russell 3,000 year-to-date (that trade higher than $5/share). As you’ll notice, Biotech stocks dominate the list. This is the same way things looked back in 2014 and 2015, but not in 2016 when Biotech names mostly plummeted.
Nine of the ten best performing stocks in the Russell 3,000 are Biotech names, with Applied Optoelectronics (AAOI) the one Technology stock in the middle. Esperion Therapeutics (ESPR) is up the most with a YTD gain of 216.7%, followed by ViewRay (VRAY) ant Global Blood Therapeutics (GBT) at 170%+.
There aren’t a lot of large-cap names on the top 40 list — Chemours (CC) has the highest market cap at $6.35 billion.
If you like Bespoke’s relative strength charts, become a Bespoke Premium or Bespoke Institutional member today and check out our “Sector Snapshot” section.
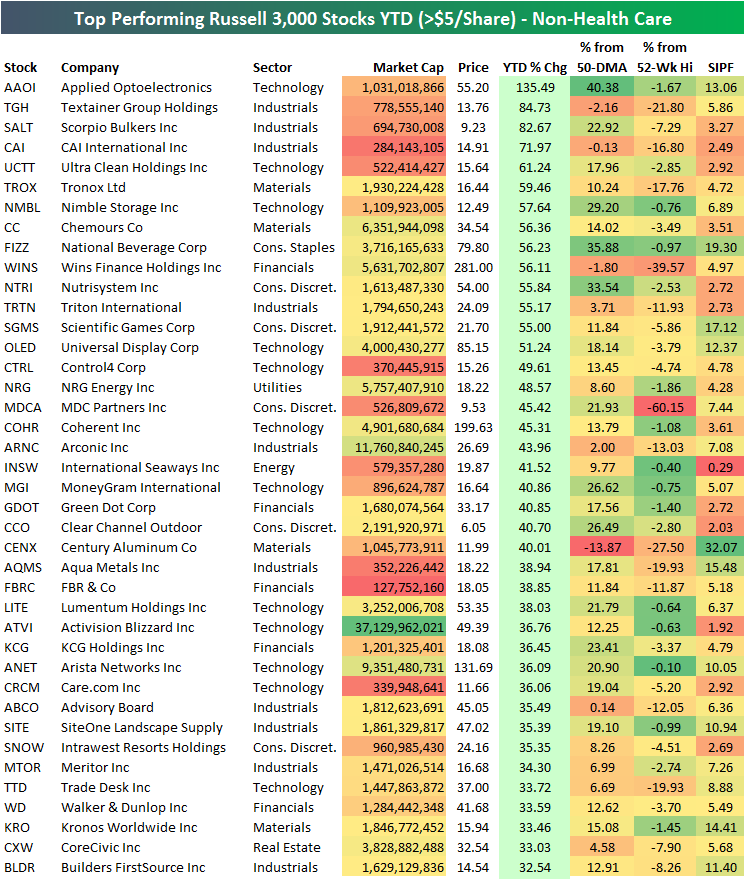
Below we’ve created another top 40 list with all Health Care sector stocks removed. Activision Blizzard (ATVI) is the largest stock on this list with a market cap of $37.1 billion and a YTD gain of 36.8%. Once again, though, there aren’t a lot of well-known names on the list. If you have some time, definitely browse through the company descriptions and charts of the year’s best performers to see if you find any names that are intriguing.
The View From The Top
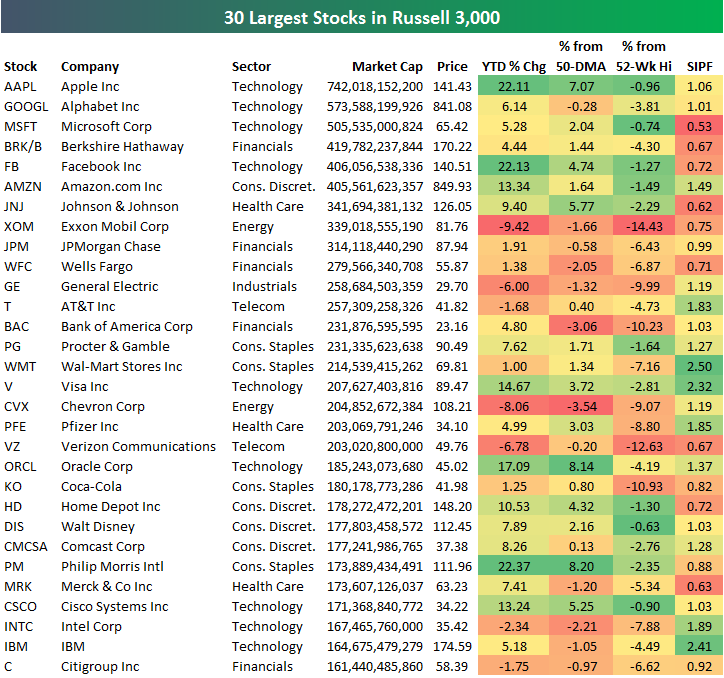
Below is a look at the 30 largest publicly traded US stocks (based on market cap). As shown, Apple (AAPL) sits at the top by a wide margin after posting a 22% YTD gain thus far in 2017. The stock is currently 7% above its 50-day moving average and less than 1% from its all-time high. Alphabet (GOOGL), Microsoft (MSFT), Berkshire Hathaway (BRK/B), and Facebook (FB) round out the top five, and all have market caps greater than $400 billion. Amazon.com (AMZN) is less than half a billion in market cap away from Facebook (FB), leaving AMZN in the #6 spot. Exxon Mobil (XOM), which was the largest company in the world for many years until Apple (AAPL) eclipsed it, now ranks as the 8th largest company in the US. Even Johnson & Johnson (JNJ) is now bigger than XOM.
Along with Berkshire, two additional Financial sector stocks rank in the top ten. JP Morgan (JPM) and Wells Fargo (WFC) rank #9 and #10.
Like Exxon, another company that used to sit at the top of this list is General Electric (GE). With a market cap of $258 billion, GE doesn’t even crack the top ten at this point. Wal-Mart (WMT) is yet another name that used to sit at or near the top, but now the company is only the 15th largest company in the US. Remarkably, online retail giant Amazon.com has a market cap that is nearly double the size of Wal-Mart. There’s no better example of “Death by Amazon” than that.
If you like Bespoke’s research, become a Bespoke Premium or Bespoke Institutional member today.
ETF Trends: International – 3/24/17
Treasuries, precious metals, and EM have been the best performers over the last few weeks with natural gas prices also rising. Worst performers are found in banking, biotech, solar, Energy, and retail. We also note a number of small and micro cap equities under-performing sharply.

Bespoke provides Bespoke Premium and Bespoke Institutional members with a daily ETF Trends report that highlights proprietary trend and timing scores for more than 200 widely followed ETFs across all asset classes. If you’re an ETF investor, this daily report is perfect. Sign up below to access today’s ETF Trends report.
See Bespoke’s full daily ETF Trends report by starting a no-obligation free trial to our premium research. Click here to sign up with just your name and email address.
Bespokecast Episode 8 — PJ Gorynski — Now Available on iTunes, GooglePlay, Stitcher and More
 We’re happy to announce that the newest episode of Bespokecast is now available to the general public both here and via the various podcast platforms. Be sure to subscribe to Bespokecast on your preferred podcast app to gain access to our full collection of episodes. We’d also love for you to provide a review as well!
In our newest conversation on Bespokecast, we speak with Bespoke Market Intelligence co-founder PJ Gorynski. PJ runs Bespoke’s primary research business, conducting consumer and business surveys for institutional clients that offer insight into the trends and drivers of businesses. In our wide-ranging conversation, we discuss how clients use Bespoke’s survey data to see deeper into business models, also discussing the state of the hedge fund industry and specific names covered in PJ’s research including Chipotle (CMG), GameStop (GME), Snapchat (SNAP), and Volkswagen (VLKAY). The Queens native also gives us some insight into the best pizza in New York and the agony of New York Mets fandom. We hope you enjoy the conversation!
Each new episode of our podcast features a special guest to talk markets with, and Bespoke subscribers receive special access before it’s made available to the general public. If you’d like to try out a Bespoke subscription in order to gain access to these podcasts in advance, you can start a two-week free trial to check out our product. To listen to episode 8 or subscribe to the podcast via iTunes, GooglePlay, OvercastFM, or Stitcher, please click below.

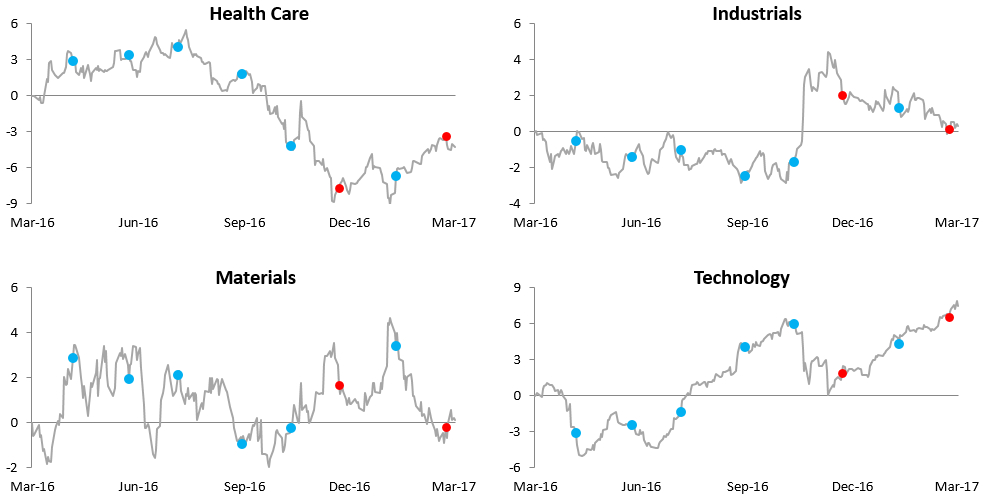
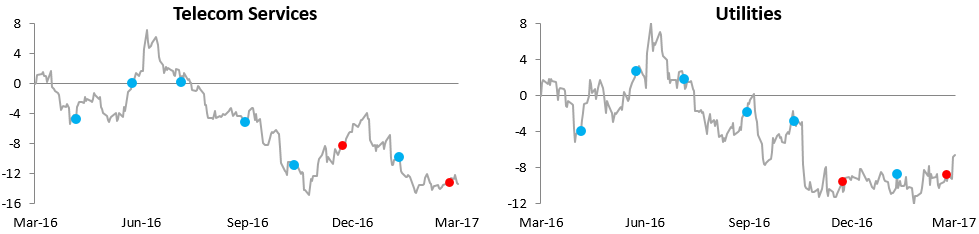
FOMC Hikes Halt Financial Sector Rally
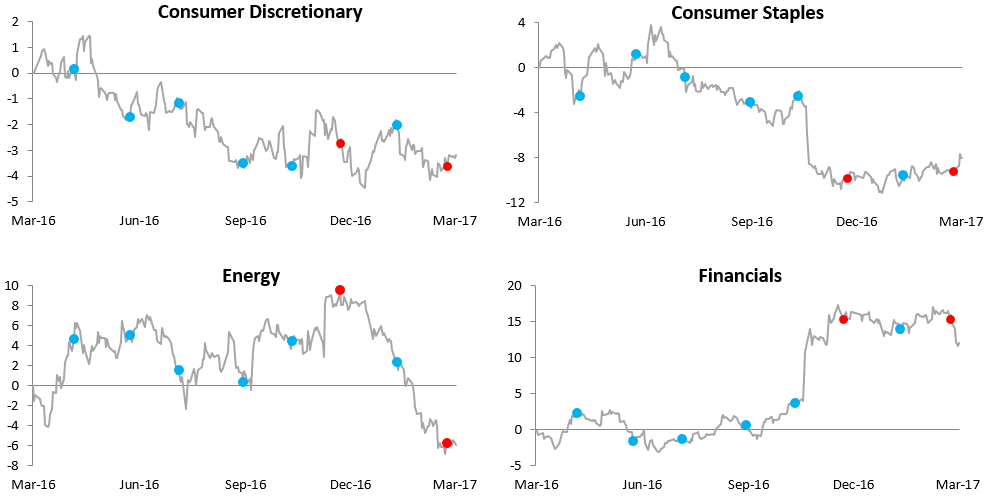
Below we provide relative strength charts for ten S&P 500 sectors. Each chart shows the sector’s performance over the last year relative to the S&P 500. When the line is rising, it means the sector is outperforming the S&P 500. When the line is falling, it means the sector is underperforming the S&P 500. The dots on each chart represent FOMC rate decision days. Blue dots are FOMC days where the Fed held rates the same. Red dots are FOMC days where the Fed hiked rates.
A few things worth noting:
Two defensive sectors — Consumer Staples and Utilities — have begun to outperform again after underperforming for most of the past twelve months. Health Care also appears to have put in a bottom and has really done well versus the broad market lately. Energy looks the opposite of Health Care. It outperformed for most of 2016 up until the Fed hiked rates in December, and since then it has been straight down.
The relative strength chart for Technology is telling as well. In the initial weeks after the election, Tech underperformed some of the more “Trump-friendly” sectors. But since early December, Tech has been on a tear. It’s really the only cyclical sector that hasn’t skipped a beat over the last four months.
Finally, Financials and Industrials both experienced significant outperformance in the first six weeks after Trump was elected last November. But the Industrials sector has given up nearly all of its post-Election outperformance at this point, while Financials has performed only inline with the market since the Fed hiked rates last December. The most recent rate hike in early March sparked another round of selling in the Financials. Ironically, it was the prospect of higher interest rates that sparked Financial stocks higher, but the days that the FOMC actually hiked rates in both December and March resulted in near-term tops for the sector. The Fed commentary that came along with the most recent FOMC hike was interpreted as more dovish than expected, and since then Financials have traded lower.
If you like Bespoke’s relative strength charts, become a Bespoke Premium or Bespoke Institutional member today and check out our “Sector Snapshot” section.
The Closer — New Homes Soar, Peso Wants More — 3/23/17
Log-in here if you’re a member with access to the Closer.
Looking for deeper insight on global markets and economics? In tonight’s Closer sent to Bespoke Institutional clients, we review existing home sales and the performance of the Mexican peso.

The Closer is one of our most popular reports, and you can sign up for a free trial below to see it!
The Closer is one of our most popular reports, and you can see it and everything else Bespoke publishes by starting a no-obligation 14-day free trial to our research!
Chart of the Day: Advance Disposal Services (ADSW)
Checking Up on Internals
With equities surging to start the month of March and drifting lower ever since, questions over whether the March 1st rally marked some sort of last gasp peak have grown increasingly common. Whenever we get questions like this, our first inclination is to look at the market’s internals to see whether a new high in the index was confirmed by the performance of individual stocks in the index. In a B.I.G. Tips report sent out to subscribers earlier, we provided a detailed look at two key breadth measures we’ve found to be extremely useful over the years in terms of measuring the health of the market. To see the results of this must-see analysis, sign up for a monthly Bespoke Premium membership now!