ETF Trends: US Indices & Styles – 4/6/17
Gold miners, natural gas, Philippines, and oil were the biggest ETF gainers over the past week with India and MLPs also performing well. With USDJPY and the Nikkei down, DXJ has underperformed sharply, as have Banks, microcaps, small caps, and biotech.

Bespoke provides Bespoke Premium and Bespoke Institutional members with a daily ETF Trends report that highlights proprietary trend and timing scores for more than 200 widely followed ETFs across all asset classes. If you’re an ETF investor, this daily report is perfect. Sign up below to access today’s ETF Trends report.
See Bespoke’s full daily ETF Trends report by starting a no-obligation free trial to our premium research. Click here to sign up with just your name and email address.
Chart of the Day: 2017 Sector Heatmaps
B.I.G. Tips – March Employment Report Preview
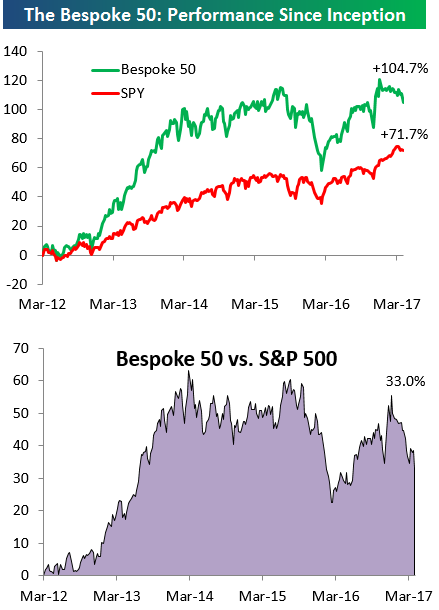
the Bespoke 50 — 4/6/17
Every Thursday, Bespoke publishes its “Bespoke 50” list of top growth stocks in the Russell 3,000. Our “Bespoke 50” portfolio is made up of the 50 stocks that fit a proprietary growth screen that we created a number of years ago. Since inception in early 2012, the “Bespoke 50” has beaten the S&P 500 by 33 percentage points. Through today, the “Bespoke 50” is up 104.7% since inception versus the S&P 500’s gain of 71.7%. Always remember, though, that past performance is no guarantee of future returns.
To view our “Bespoke 50” list of top growth stocks, sign up for Bespoke Premium ($99/month) at this checkout page and get your first month free. This is a great deal!
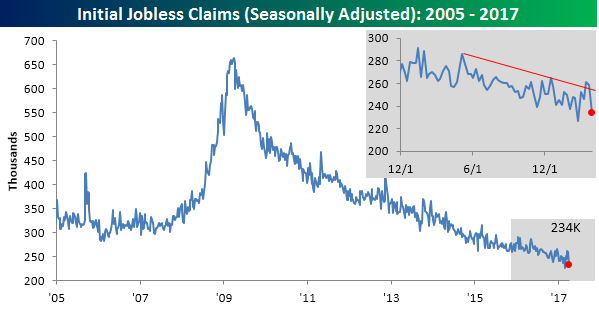
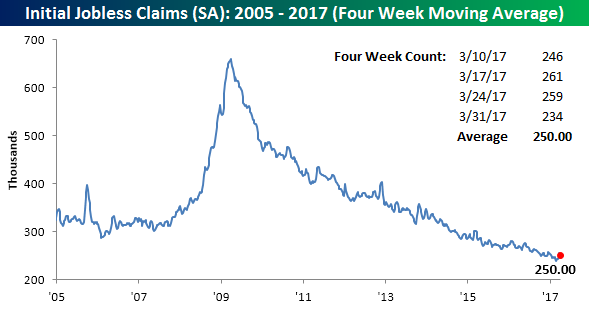
Jobless Claims Back on the Decline
After two straight weeks where jobless claims exceeded 250K and concerns started to surface that jobless claims were beginning to trend higher, this week’s print alleviated some of those fears as claims dropped to a six-week low of 234K. As shown in the chart below, this week’s decline also put claims back below the trend that was broken to the upside last week and marks the 109th straight week where claims have been below 300K.
With this week’s decline, the four-week moving average dropped by 4.5K down to 250K. That’s just 10.25K above the post-recession low of 239.75K from six weeks ago back in late February.
On a non-seasonally adjusted basis, claims were just as strong, falling from 228.5K down to 207.6K. For the current week of the year, this week’s print was the lowest level since 1973, and it’s more than 120K below the average of 328.4K for the current week of the year dating back to 2000.

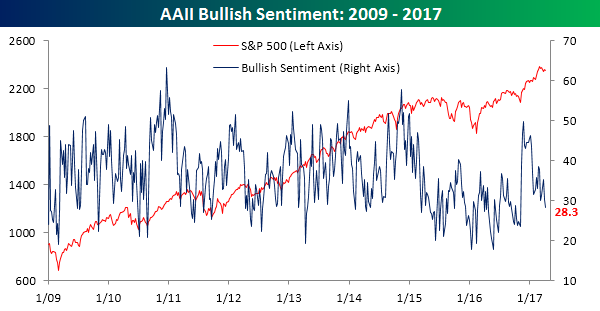
Bulls Take a Hike
The most negative group of investors turned even more bearish again this week. According to the weekly sentiment survey from AAII, only 28.3% of individual investors considered themselves bullish in the last week. That’s down from an already low reading of 30.2% last week, and it’s the lowest weekly reading seen since before the election. This week’s decline also extends the record streak of consecutive weekly readings where bullish sentiment was below 50% to 118.
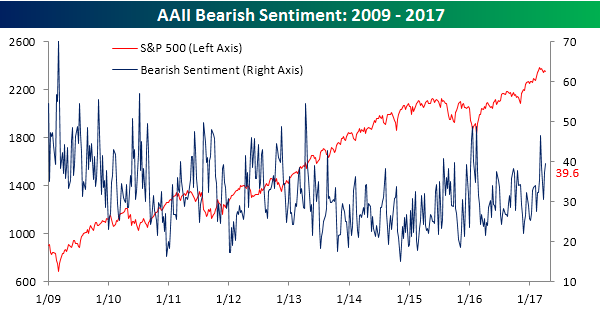
Bearish sentiment, meanwhile, rose to just under 40% this week (39.6%), marking the fourth week in the last five where bears have outnumbered bulls. Considering where the S&P 500 currently sits relative to all-time highs, that is pretty amazing.
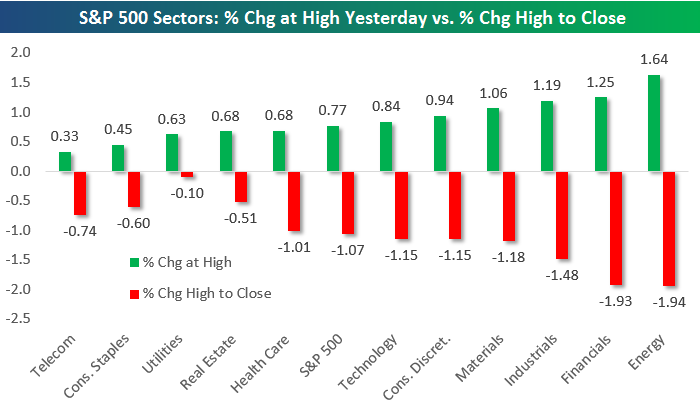
The Higher They Go, the Harder They Fall
As we tweeted yesterday afternoon, yesterday was the first time since February 2016 that the S&P 500 closed down on the day after trading up more than 75 basis points at its highs. Below is a look at sector performance so you can see where the late-day weakness came from. In the chart, we show how much each S&P 500 sector was up at its highs yesterday, and we also show how much each sector fell from its highs to its closing level.
The S&P 500 as a whole was up 77 basis points at its high and it fell 1.07% from its high to the close. As you can see below, the sectors that were up the most at their highs ended up selling off the most. The sectors that were up the least on the day at their highs ended up selling off the least.
Financials and Energy got hit the hardest during the afternoon sell-off. Energy was up 1.64% at its highs before selling off nearly 2% into the close. Financials was up 1.25% at its high and then went on to fall 1.93% into the close. A defensive sector like Utilities, on the other hand, closed nearly at its high for the day as investors moved from cyclicals into safer areas of the market.
The Closer — Surveying The States: Unemployment And REERs — 4/5/17
Log-in here if you’re a member with access to the Closer.
Looking for deeper insight on global markets and economics? In tonight’s Closer sent to Bespoke Institutional clients, we take a look at unemployment in metro areas and the real effective exchange rate facing individual states.

The Closer is one of our most popular reports, and you can sign up for a free trial below to see it!
The Closer is one of our most popular reports, and you can see it and everything else Bespoke publishes by starting a no-obligation 14-day free trial to our research!
Chart of the Day: How Big a Concern is the Drop in Auto Sales?
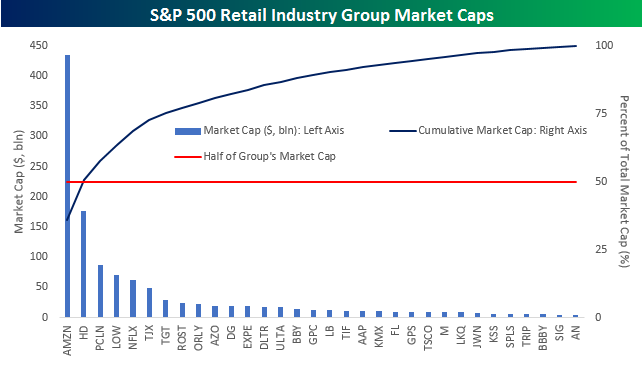
Top Heavy Retail
Amazon.com (AMZN) is the stock that continues to amaze. On Wednesday, it traded up another 1% in early trading, marking its eighth straight day of gains. In just that eight trading day span, the company has seen its market cap increase by over $30 billion which is more than the entire market cap of Target (TGT)! The S&P 500 Retail Industry Group currently consists of 32 companies across a wide variety of the retail landscape, but interestingly enough, Wal-Mart (WMT) isn’t one of them as it is considered part of the Food & Staples Retail Industry Group. Not including the Food and Staples retailers (where AMZN is also growing an increasingly large foothold), AMZN continues to steadily increase its size within the Retail group.
With a market cap of over $400 billion, AMZN is by far the largest component in the S&P 500 Retailing industry Group, accounting for more than a third of the group’s market cap. The chart below shows the market cap of each company in the S&P 500 Retailing Industry Group. With that, we have also included a line that shows the cumulative market cap of companies in the group from left to right. So, at a market cap of $434 billion, AMZN accounts for 36% of the group’s market cap. The next largest company in the group is Home Depot (HD), with a market cap of $177 billion. Together, AMZN and HD account for more than half of the group’s market cap. Then, if you add in Priceline (PCLN) and Lowe’s (LOW), you’re up to just under two-thirds of the entire group’s market cap! Talk about top heavy! Even in the broader S&P 1500, which includes more than 90 stocks, AMZN still accounts for one-third of the group. As AMZN and the largest stocks in the Retail group have grown, the remaining stocks are becoming increasingly irrelevant.