Chart of the Day: From Hero to Zero- Tech Sector Losing Streaks
Fixed Income Weekly – 4/12/17
Searching for ways to better understand the fixed income space or looking for actionable ideals in this asset class? Bespoke’s Fixed Income Weekly provides an update on rates and credit every Wednesday. We start off with a fresh piece of analysis driven by what’s in the headlines or driving the market in a given week. We then provide charts of how US Treasury futures and rates are trading, before moving on to a summary of recent fixed income ETF performance, short-term interest rates including money market funds, and a trade idea. We summarize changes and recent developments for a variety of yield curves (UST, bund, Eurodollar, US breakeven inflation and Bespoke’s Global Yield Curve) before finishing with a review of recent UST yield curve changes, spread changes for major credit products and international bonds, and 1 year return profiles for a cross section of the fixed income world.
In this week’s note, we project the pace at which principal would be repaid on instruments held by the Fed in its SOMA portfolio assuming an immediate halt to reinvestment of principal from those QE purchases.

Our Fixed Income Weekly helps investors stay on top of fixed income markets and gain new perspective on the developments in interest rates. You can sign up for a Bespoke research trial below to see this week’s report and everything else Bespoke publishes free for the next two weeks!
Click here to start your no-obligation free Bespoke research trial now!
ETF Trends: Fixed Income, Currencies, and Commodities – 4/12/17
Despite the furious rally in oil over the past five days (with USO and DBO taking the top two spots within the universe of ETFs we track) Russian equities have been among the worst performers. Base metals, natural gas, steel, semis, and EM countries have also underperformed though Turkey and South Africa have both been big gainers. Retail, REITs, and gold miners have also been good performers.

Bespoke provides Bespoke Premium and Bespoke Institutional members with a daily ETF Trends report that highlights proprietary trend and timing scores for more than 200 widely followed ETFs across all asset classes. If you’re an ETF investor, this daily report is perfect. Sign up below to access today’s ETF Trends report.
See Bespoke’s full daily ETF Trends report by starting a no-obligation free trial to our premium research. Click here to sign up with just your name and email address.
48,000 Down to 1
While stock splits have no economic impact on the value of a company’s operations or finances when they split their stock and increase the number of shares outstanding it is generally considered a sign of optimism regarding the future and the potential for a higher share price. Conversely, reverse stocks splits, where a company lowers the number of shares outstanding, are considered a last ditch effort to boost a company’s extremely low share price. Rarely do they ever work. A perfect case in point is Dryships (DRYS).
Let’s say that back in early 2016, you decided to completely unplug from the market and buy and hold. Now, sixteen months later you decide to look and see how things have done while you “set it and forget it.” You head over to Yahoo! Finance and start looking to see how the prices of various stocks you hold have done during this time. One of the stocks you held was Dryships (DRYS). At a current price of $1.70, you think to yourself, “That’s pretty good since the stock was trading at under 20 cents at the start of 2016.” With 48,000 shares, that position is now worth over $80K, which is no small chunk of change, so you decide to take the money and run. But when you go over to your Schwab account and login, you see that your current position is just a single share. What the heck happened?
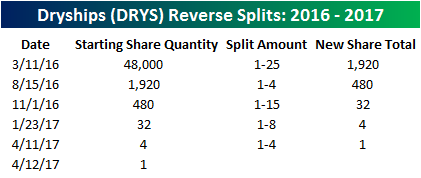 Welcome to the wonderful world of reverse stock splits. As shown in the table to the right, since the start of 2016 DRYS has had not one, not two, not three, not four, but five reverse stock splits! Back in March 2016, it had a reverse split of 1-25, which means your original 48,000 shares suddenly shrunk to just 1,920 shares. Then, five months later in August, it did another 1-4 reverse split, reducing the 1,920 shares down to 480. Just three months later, DRYS did another 1-15 split, so those 480 shares you now held were reduced to just 32 shares. The reverse splits continued in 2017 and on 1/23, DRYS did a reverse split of 1-8, which reduced those 32 shares to just four. Then, yesterday DRYS did another reverse split of 1-4 shares reducing your original 48,000 down to just one measly share trading at $1.70.
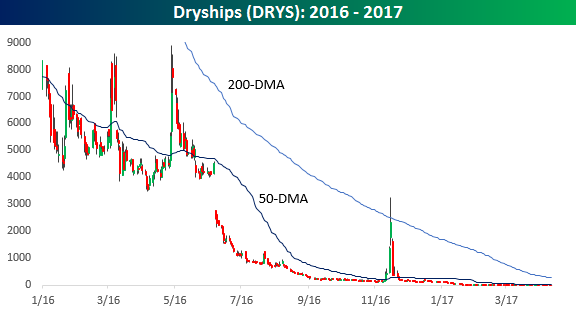
When you adjust for all the reverse splits in DRYS, its price chart is really something to behold. On a split-adjusted basis, DRYS was trading at over $8,000 per share back in early 2016. Following the election, the stock saw another brief spike, but quickly came back to earth, and now trades at under $2 per share. Over the last sixteen months, Dryships has done nothing but take on water!
The Closer — North America Data Wrap, Bank Lending Concerns, Bond Yield Break — 4/11/17
Log-in here if you’re a member with access to the Closer.
Looking for deeper insight on global markets and economics? In tonight’s Closer sent to Bespoke Institutional clients, we look at Mexican industrial production, today’s JOLTS report in the US, take a look at what signal may be lurking in deteriorating bank lending data, and finally take a look at the breakdown in UST yields posted today.
The Closer is one of our most popular reports, and you can sign up for a free trial below to see it!
The Closer is one of our most popular reports, and you can see it and everything else Bespoke publishes by starting a no-obligation 14-day free trial to our research!
Stocks on the Cusp of Finally Making “The List”
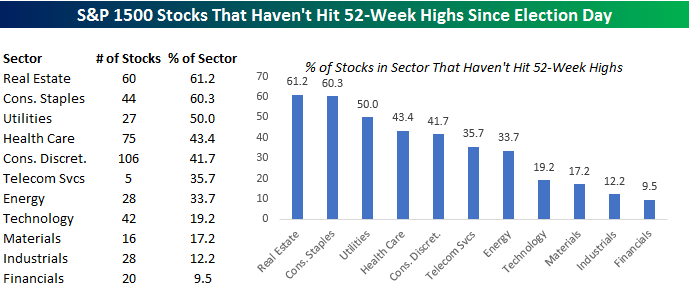
It may seem like just about every stock in the market has been hitting 52-week highs over the last few months, but within the S&P 1500 there are 451 stocks in the index that have not hit a 52-week high since the election. That’s nearly a third of the index! Among those stocks, some like Prologis (PLD) are within 1% of a new high, while others like Adeptus Health (ADPT) and Tidewater (TDW) are currently trading more than 90% below their 52-week highs. In other words, it is a very wide range. From a sector perspective, we all remember how Financials surged after the election, so it should come as no surprise that it is the only sector where less than 10% of the stocks in it haven’t hit a 52-week high since November 8th. On the other side of the spectrum, high yielding stocks underperformed post-election as interest rates rose, and that explains why at least half of the stocks in the Real Estate, Consumer Staples, and Utilities sectors haven’t hit 52-week highs since the election.
Each morning when we update our daily charts of the stocks hitting new highs and new lows as part of the Morning Lineup, you may have noticed that it seems as though more often than not, once a stock first starts showing up on the “new highs” list, it tends to keep showing up over and over again going forward. This is your typical “breakout” pattern. With this in mind, we want to look for stocks that are not quite at new highs yet but are getting close. Once they make their new high, the sky is the limit. Earlier today we screened the S&P 1500 for all the stocks in the index that have not hit a 52-week high since the election but are currently within 5% of that level. While 41 stocks fit that criterion, we went through each of the charts to look for the names that are the least extended and have the most attractive chart patterns. To see this list of stocks “on the cusp,” sign up for a monthly Bespoke Premium membership now!
Small Business Optimism Posts Modest Decline
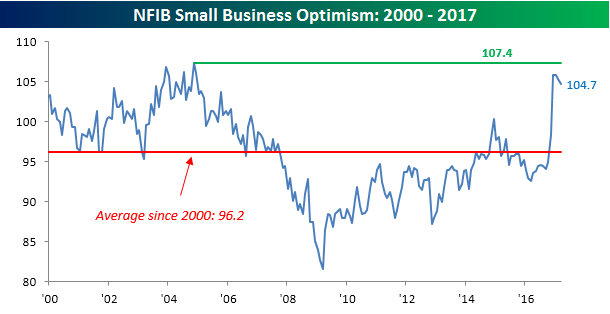
Today’s March release of the index of small business optimism declined for the second straight month, but when you put this decline in the perspective of the massive surge we saw towards the end of 2016 and into 2017, it is hardly a big cause for concern, at least not at this point. As shown in the chart below, the index came in at 104.7 this month, which was inline with expectations and just 1.2 points below its multi-year high of 105.9. Not only that, but the index is also well above its long-term average of 96.2 dating back to 2000. Looking into the details of the report this month, there were some comments suggesting that the surge in confidence from the last few months is translating into actual activity. As mentioned in the report, “there is growing evidence that this optimism is being translated into more spending and hiring, although not at explosive rates.” Hey, it’s a start.
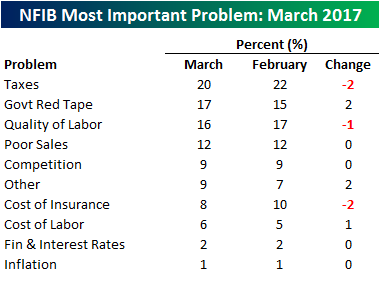 As we do each month, we also wanted to summarize what issues small businesses consider to be their biggest problems. In this month’s survey, Taxes remain the biggest problem for small businesses, with a fifth of all respondents citing them as their biggest issue. That’s high but is actually down from 22% last month. Along with Taxes, Government Red Tape moved back into the second spot at 17% and is followed by Quality of Labor at 16%. Even though labor quality remains a pretty big problem, Cost of Labor still hasn’t seen as much of an uptick as one might expect. Equally notable is the fact that only 1% of small businesses cited Inflation as their biggest problem. With prices rising in the last year, we would have expected at least a small uptick in this reading.
On a final note, one aspect of this month’s report that we found interesting is the Uncertainty Index tracked by the NFIB report. In this month’s report, uncertainty increased from 86 to 93. Going back to 1975, that’s the second highest monthly reading in the history of the index, behind only the 100 reading that we saw back in November leading up to the election. The chart below shows the movement of this index going back to 1975. What strikes us as so ironic about this index is how it has generally trended upwards over time even as technology has advanced and countless hours have been spent researching and trying to smooth the business cycle. Have all these advances only made business more complicated?
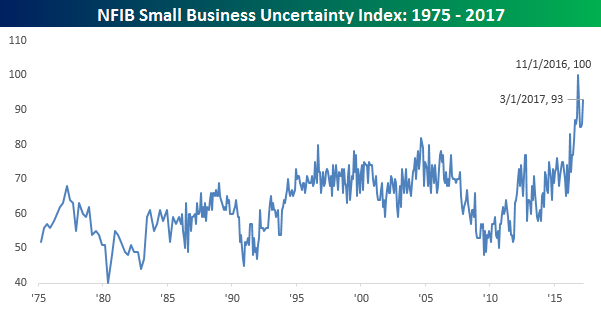
Chart of the Day: At Cruising Altitude & Capacity
Bespoke Stock Scores: 4/11/17
ETF Trends: International – 4/11/17
WTI has delivered a major rally over the last two weeks, despite a modest decline today. Energy has benefited while the Philippines and Turkey have paced global equity returns over the past week. Retail has also bounced along with bond prices and REITs. Despite the oil rally, Russia has been the worst performing ETF over the past week. South Korea and Brazil have both declined along with steel, base metals, banks, and semiconductors.
Bespoke provides Bespoke Premium and Bespoke Institutional members with a daily ETF Trends report that highlights proprietary trend and timing scores for more than 200 widely followed ETFs across all asset classes. If you’re an ETF investor, this daily report is perfect. Sign up below to access today’s ETF Trends report.
See Bespoke’s full daily ETF Trends report by starting a no-obligation free trial to our premium research. Click here to sign up with just your name and email address.