S&P 500 Quick-View Chart Book — 4/21/17
“Irrational Exuberance” Reading Explodes Higher
The commentary and charts below have been pulled from our daily post-market macro note — The Closer — which is part of our Bespoke Institutional research offering. If you’d like to see more research like this plus actionable individual stock and ETF ideas, please start a 14-day no obligation free trial to Bespoke Institutional.
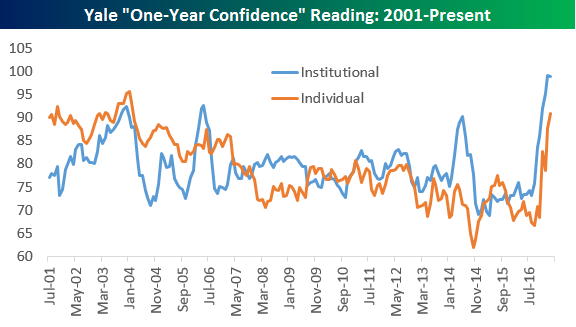
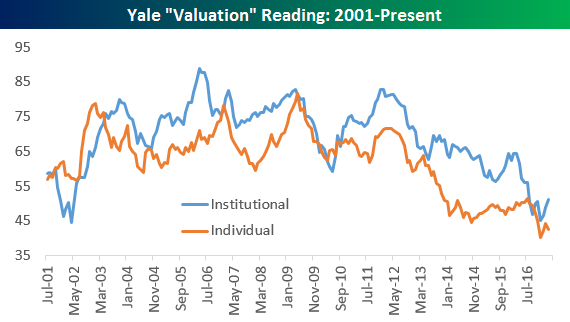
Over the last couple of decades, the International Center for Finance at Yale University has regularly surveyed both individual and institutional investors and asked them about their views of the market. There are four major questions: one year confidence, buy-on-dips confidence, crash confidence, and valuation confidence. We’re going to focus on two of those today: “one-year confidence” and “valuation confidence”. One-year confidence is the percent of investors expecting a positive return for the Dow Jones Industrial Average over the next year. Valuation confidence is the percentage of investors who are confident in the valuation of the market, meaning they think the market is valued either too low or about right. The confidence indices are shown for both individual investors and institutional investors, and we highlight charts of the two readings below.
As you can see in the “One-Year Confidence” chart, according to Yale’s survey, investors have gotten crazy bullish on stocks over the last few months. Institutional investors are extremely bullish: less than 2% don’t expect gains for the Dow over the next year! Individual investors are the most bullish since February 2004, when 93.4% expected gains. Currently, over 90.9% expect further gains.
While investors are crazy bullish on the market over the next year, they aren’t attracted to the market’s valuation. As shown in the second chart below, a historically low share of investors think the market is cheap; Valuation Confidence from both individual and institutional investors is near the lowest levels on record.
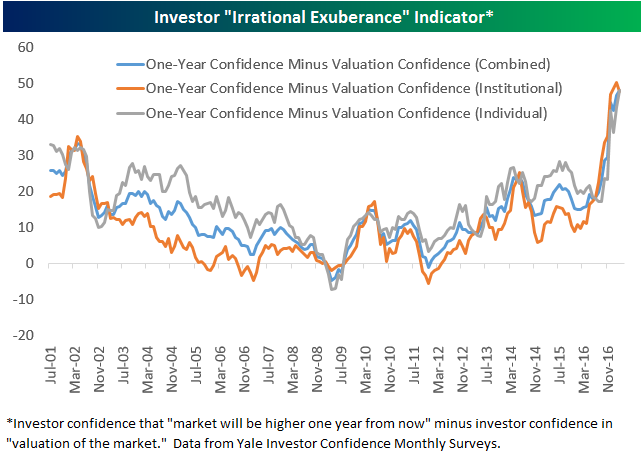
So what do you call high confidence that the market will be higher a year from now while at the same time not liking the valuation of the market? Some would say “irrational exuberance.” We decided to create an “irrational exuberance” indicator from this survey data which is simply Valuation Confidence subtracted from One Year Confidence. As shown below, this reading has exploded higher recently for both institutional and individual investors.
The chart below only shows the combined “irrational exuberance” indicator based on the average of the institutional and individual investor readings. When the reading is positive, it means confidence that the market will be higher one year from now is higher than confidence in the valuation of the market. The opposite is the case when the reading is in negative territory.
The key takeaway from our combined “irrational exuberance” indicator is that investors think simultaneously that the market is over-valued but likely to keep climbing: that’s the exact phenomenon famously described by former Fed Chair Alan Greenspan in a December 1996 speech. Robert J. Shiller, the originator of the Yale Investor Confidence series, is rumored to have first invented the term; he later wrote a book with the same title.
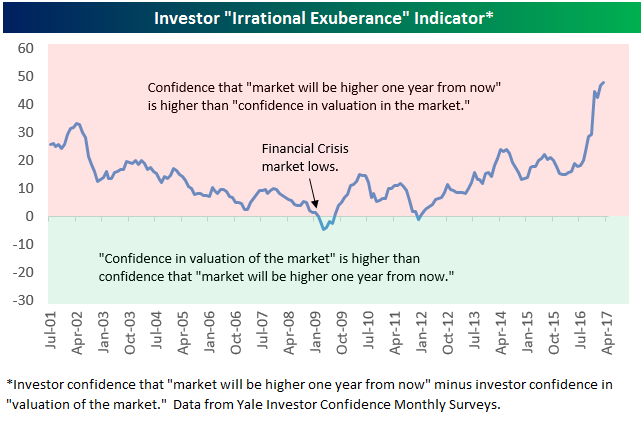
While the Yale Confidence series aren’t a very good short-term market-timing tool, we can say that lower readings on our “irrational exuberance” indicator generally come at lower levels of the market. As shown above, the low of the reading came just after the lows for the market during the Financial Crisis. We also think that as a general proposition, if a huge share of investors think that the market is expensive but are still optimistic, the market’s psychology is fragile.
Equity valuations are not as extended now as they’ve been in true bubble territory (the tech bubble). That said, we do think this reading should make investors a bit cautious given that so many expect gains despite having little conviction in valuations.
The commentary and charts above were pulled from our daily post-market macro note — The Closer — which is part of our Bespoke Institutional research offering. If you’d like to see more research like this plus actionable individual stock and ETF ideas, please start a 14-day no obligation free trial to Bespoke Institutional.
ETF Trends: Fixed Income, Currencies, and Commodities – 4/21/17
Banks have come back over the last few days with KRE and KBE leading returns in the ETF universe we monitor. Turkey was the best performing country ETF globally, while retail, semis, and transports have all moved higher as well. The worst performers over the past week have been coffee, oil and energy, gold miners, and other commodity-linked ETFs.

Bespoke provides Bespoke Premium and Bespoke Institutional members with a daily ETF Trends report that highlights proprietary trend and timing scores for more than 200 widely followed ETFs across all asset classes. If you’re an ETF investor, this daily report is perfect. Sign up below to access today’s ETF Trends report.
See Bespoke’s full daily ETF Trends report by starting a no-obligation free trial to our premium research. Click here to sign up with just your name and email address.
Technology Stocks Winning the “Beat” Game
We’re now right smack dab in the middle of earnings season, so today we wanted to highlight a couple of interesting sector trends we’ve recently identified. Thanks to our Interactive Earnings Report Database, we have a list of every single quarterly earnings report for US stocks going back to 2001. For each report, we know whether the stock beat or missed consensus earnings and revenue estimates and how the stocks performed.
Using our database, we track the rolling 3-month earnings beat rate for all US stocks. This shows the percentage of companies that are beating consensus analyst earnings per share estimates over time. We also track the rolling 3-month earnings beat rate by sector.
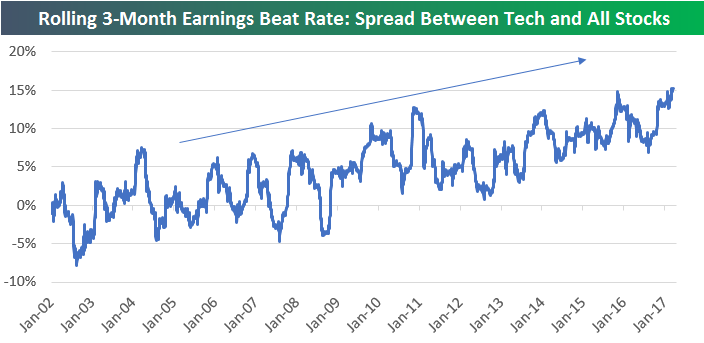
Below is a chart showing the rolling 3-month earnings beat rate for all US stocks compared to just Technology stocks. As you can see, from 2002 through 2009, the earnings beat rate for Tech stocks generally tracked the beat rate for all stocks. But during the current bull market that began in early 2009, we’ve seen Tech stocks separate from the pack when it comes to beating analyst earnings estimates. Since 2014, the divergence has gotten even more prominent. As of now, the rolling 3-month earnings beat rate for Tech stocks stands at 75%, while the beat rate for all stocks is just 60%.

You can see the spread between the beat rate for Tech and the beat rate for all stocks in the chart below. Over the years, Tech stocks have gotten better and better than the rest of the market at beating analyst earnings estimates. Whether that’s the result of legitimate strength for the sector (it has outperformed) or Tech accounting departments getting better and better at “beating the number” is a different story. We honestly don’t know the answer, but it’s probably a little bit of both.
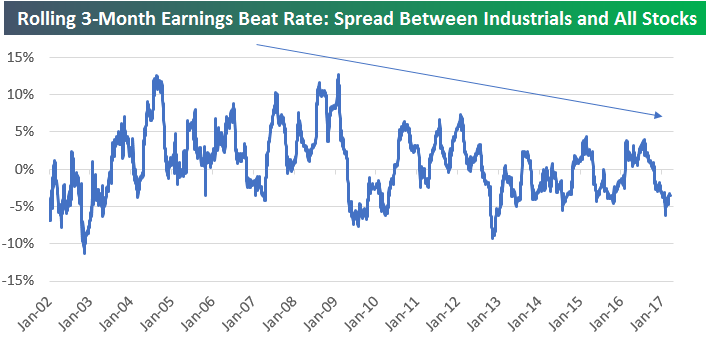
A counter example is the Industrials sector. Below is the rolling 3-month earnings beat rate for Industrials stocks versus the 3-month beat rate for all stocks. Unlike Tech, these two data series have been tracking each other very closely for the last 15 years. If anything (as shown in the second chart), Industrials stocks have gotten worse at beating estimates.
Start a 14-day free trial to see more of Bespoke’s earnings analysis.

The Closer — Irrational Exuberance, Claims Clean, Golden Outlook — 4/20/17
Log-in here if you’re a member with access to the Closer.
Looking for deeper insight on global markets and economics? In tonight’s Closer sent to Bespoke Institutional clients, we introduce our “irrational exuberance” indicator, also discussing jobless claims and the outlook for gold.

The Closer is one of our most popular reports, and you can sign up for a free trial below to see it!
The Closer is one of our most popular reports, and you can see it and everything else Bespoke publishes by starting a no-obligation 14-day free trial to our research!
Bespoke’s Sector Snapshot — 4/20/17
We’ve just released our weekly Sector Snapshot report (see a sample here) for Bespoke Premium and Bespoke Institutional members. Please log-in here to view the report if you’re already a member. If you’re not yet a subscriber and would like to see the report, please start a 14-day trial to Bespoke Premium now.
Below is one of the many charts included in this week’s Sector Snapshot, which highlights the percentage of stocks in each S&P 500 sector that are trading above their 50-day moving averages. This breadth measure helps investors identify the underlying strength of the individual members that make up a sector or index. As shown, under 50% of stocks in the S&P 500 are currently above their 50-days, and the same is true for the Health Care, Materials, Financials, and Energy sectors.
To see our full Sector Snapshot with additional commentary plus six pages of charts that include analysis of valuations, breadth, technicals, and relative strength, start a 14-day free trial to our Bespoke Premium package now. Here’s a breakdown of the products you’ll receive.
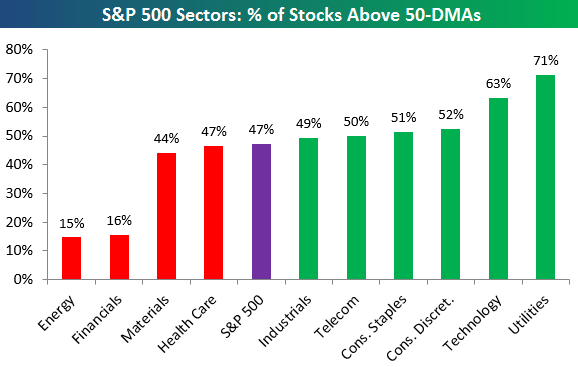
Chart of the Day: Biotech Update
 Read More
the Bespoke 50 — 4/20/17
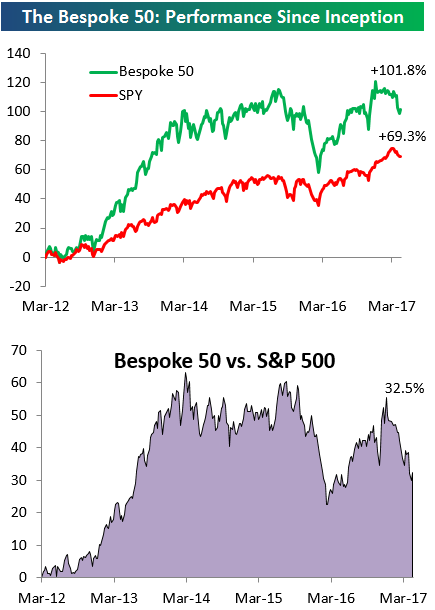
Every Thursday, Bespoke publishes its “Bespoke 50” list of top growth stocks in the Russell 3,000. Our “Bespoke 50” portfolio is made up of the 50 stocks that fit a proprietary growth screen that we created a number of years ago. Since inception in early 2012, the “Bespoke 50” has beaten the S&P 500 by 30 percentage points. Through today, the “Bespoke 50” is up 101.8% since inception versus the S&P 500’s gain of 69.3%. Always remember, though, that past performance is no guarantee of future returns.
To view our “Bespoke 50” list of top growth stocks, sign up for Bespoke Premium ($99/month) at this checkout page and get your first month free. This is a great deal!
ETF Trends: International – 4/20/17
Commodity and cylical industrial names continue to lag along with gold mining ETFs, Australia, and a number of EM countries. Best performers over the last 5 days in the ETF universe we track are South Afria, Poland, and the GBP tracker FXB. Biotechs, long-term bonds, and REITs have also found good performance.
Bespoke provides Bespoke Premium and Bespoke Institutional members with a daily ETF Trends report that highlights proprietary trend and timing scores for more than 200 widely followed ETFs across all asset classes. If you’re an ETF investor, this daily report is perfect. Sign up below to access today’s ETF Trends report.
See Bespoke’s full daily ETF Trends report by starting a no-obligation free trial to our premium research. Click here to sign up with just your name and email address.
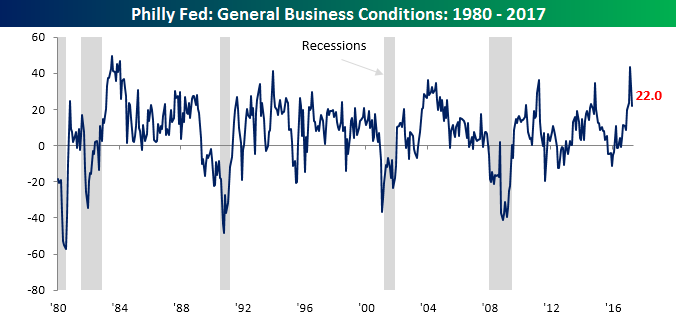
Philly Fed Follows Empire Manufacturing South
Today’s report on manufacturing in the Philadelphia region followed the trend of its sibling in New York and moved lower in April, posting a larger decline than expected. While economists were expecting the headline index to retreat from March’s multi-month high of 32.8 down to 22.5, the actual reading was slightly lower at 22.0. While both the Philly Fed and Empire Manufacturing reports declined this month, the Philly indicator still remains above levels it was at the end of 2016, even as the Empire Manufacturing report dropped to levels not seen since November.
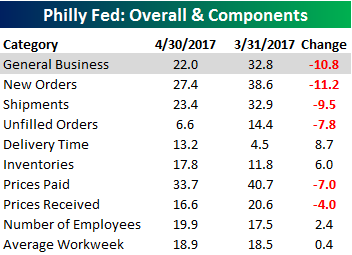 Breadth in this month’s report was also relatively weak, confirming the decline we saw in the headline reading. As shown in the table to the right, New Orders and Shipments both posted the largest declines, while the biggest increases came in Delivery Times and Inventories.
Start a 14-day free trial to unlock all of Bespoke’s market analysis.