Bespoke Consumer Pulse Data Bounces Back, But…
Each month, Bespoke runs a survey of 1,500 US consumers balanced to census. In the survey, we cover everything you can think of regarding the economy, personal finances, and consumer spending habits. We’ve now been running the monthly survey for more than two years, so we have historical trend data that is extremely valuable, and it only gets more valuable as time passes. All of this data gets packaged into our monthly Bespoke Consumer Pulse Report, which is included as part of our Pulse subscription package that is available for either $39/month or $365/year. We highly recommend trying out the service, as it includes access to model portfolios and additional consumer reports as well. If you’re not yet a Pulse member, click here to start a 30-day free trial now!
Since the election last November, pretty much all of the economic indicators we’re able to track in our monthly survey turned more bullish. In our survey prior to this month, however, things dipped slightly. Coming into this month, we were very interested to see if this dip continued or if it was just a blip. Once we got the survey data back, we were happy to see that it was more of a blip than the start of a dip.
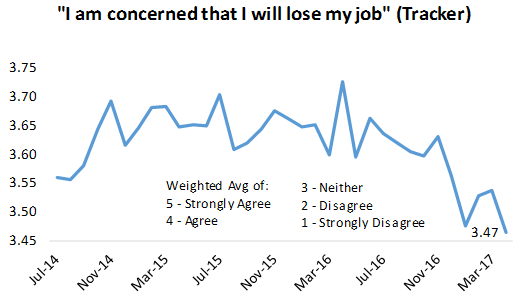
Below we highlight three charts from our Pulse survey this month that show the bounce back. The first chart is our “job loss concern” tracker. We ask consumers how concerned they are that they will lose their jobs. A high reading is bad for the economy because when people are concerned that they’ll lose their job, they’re much less likely to spend money, especially on discretionary items. As shown in the chart, our tracker actually made a new low in our survey series going back to 2014, meaning consumers are the least worried they’ve been about losing their jobs in quite some time.
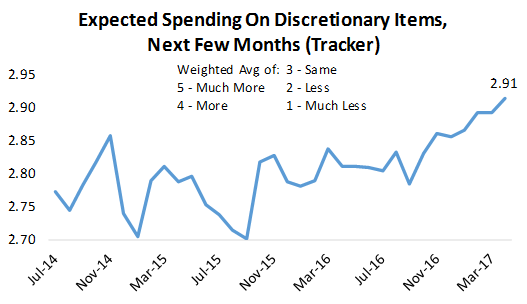
The second chart we’re featuring from this month’s Pulse report is expected spending on discretionary items. We mentioned above that employment concerns have a big impact on discretionary spending. And with employment concerns at new lows, it’s no surprise that our expected discretionary spending tracker hit a new high in our survey. Plans for spending “over the next few months” have been ticking higher now for more than six months.
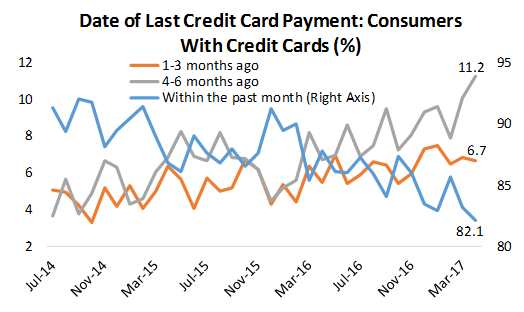
While employment is healthy and spending is expected to increase, not all was rosy in this month’s Pulse report. One thing we’re seeing is that late payments on credit cards are starting to increase. We provide more analysis of why this might be happening in our monthly Pulse report, but this is definitely something we’ll be monitoring in the months ahead.
To track additional consumer sentiment trends, click here to start a 30-day free trial to our Pulse service now!
Shanghai Composite Breaking Down
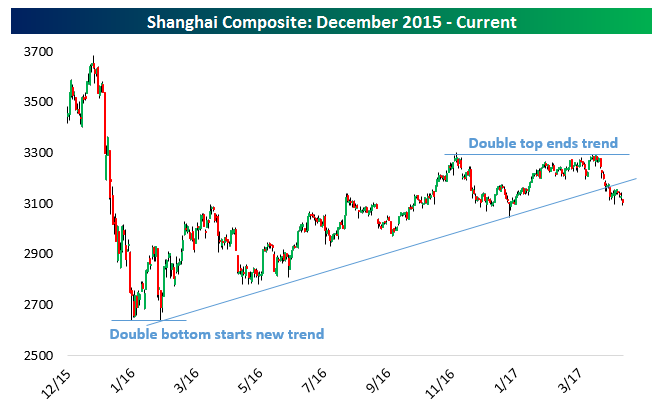
Since double-bottoming at the same time as oil did in early 2016, China’s Shanghai Composite has trended steadily higher over the past 15 months. But after making a broad double top between November and April, the index has now broken its uptrend off Q1 2016 lows. There’s a more recent trend that’s been in place since July 2016 which has been tested three times previously. The close today brought the Shanghai Composite below that trend as well. This is a bearish technical set-up.
The Closer — AHCA Passage And What’s Next, Productivity, Global Services PMIs — 5/4/17
Log-in here if you’re a member with access to the Closer.
Looking for deeper insight on global markets and economics? In tonight’s Closer sent to Bespoke Institutional clients, we take a look at what’s required for the AHCA (passed by the Republicans in the House today) to become law. We also update tracking of productivity in the US and global whole-economy and services sector PMIs.

The Closer is one of our most popular reports, and you can sign up for a free trial below to see it!
The Closer is one of our most popular reports, and you can see it and everything else Bespoke publishes by starting a no-obligation 14-day free trial to our research!
Bespoke’s Sector Snapshot — 5/4/17
We’ve just released our weekly Sector Snapshot report (see a sample here) for Bespoke Premium and Bespoke Institutional members. Please log-in here to view the report if you’re already a member. If you’re not yet a subscriber and would like to see the report, please start a 14-day trial to Bespoke Premium now.
Below is one of the many charts included in this week’s Sector Snapshot, which highlights our trading range screen for the S&P 500 and ten sectors. The black vertical “N” line represents each sector’s 50-day moving average, and as shown, four of ten sectors are below their 50-days while six are above. Both the Energy and Telecom sectors have moved into deep oversold territory. Are they due for a bounce?
To see our full Sector Snapshot with additional commentary plus six pages of charts that include analysis of valuations, breadth, technicals, and relative strength, start a 14-day free trial to our Bespoke Premium package now. Here’s a breakdown of the products you’ll receive.
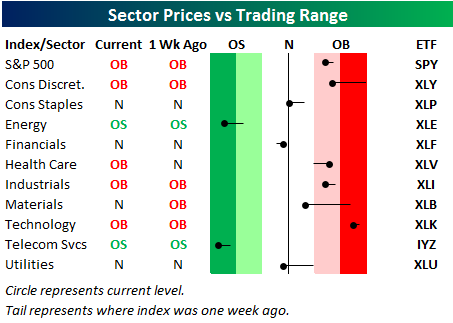
Chart of the Day: 6 Days & Counting Without A 20 bps Move, What’s Next?
ETF Trends: International – 5/4/17
Commodities continue to get hit hard with oil, metals, and silver leading the space lower. Media and REITs are also areas of weakness. On the best performers list, European equities continue to show good returns with the DAX at a new all-time high, up almost 5% since the close prior to France’s first round elections.

Bespoke provides Bespoke Premium and Bespoke Institutional members with a daily ETF Trends report that highlights proprietary trend and timing scores for more than 200 widely followed ETFs across all asset classes. If you’re an ETF investor, this daily report is perfect. Sign up below to access today’s ETF Trends report.
See Bespoke’s full daily ETF Trends report by starting a no-obligation free trial to our premium research. Click here to sign up with just your name and email address.
the Bespoke 50 — 5/4/17
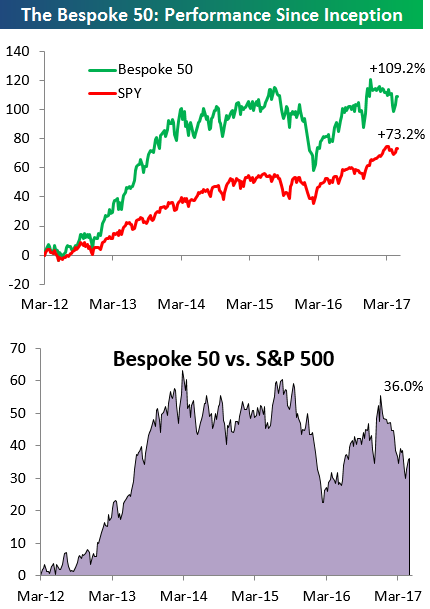
Every Thursday, Bespoke publishes its “Bespoke 50” list of top growth stocks in the Russell 3,000. Our “Bespoke 50” portfolio is made up of the 50 stocks that fit a proprietary growth screen that we created a number of years ago. Since inception in early 2012, the “Bespoke 50” has beaten the S&P 500 by 35 percentage points. Through today, the “Bespoke 50” is up 109.2% since inception versus the S&P 500’s gain of 73.2%. Always remember, though, that past performance is no guarantee of future returns.
To view our “Bespoke 50” list of top growth stocks, sign up for Bespoke Premium ($99/month) at this checkout page and get your first month free. This is a great deal!
B.I.G. Tips – April Employment Preview
Heading into Friday’s Non Farm Payrolls (NFP) report for April, economists are expecting an increase in payrolls of 190K, which would be a 92K gain from last month’s much weaker than expected reading of 98K. In the private sector, economists are also expecting an increase of 190K, which would be an even larger increase compared to the headline reading. The unemployment rate is forecasted to tick up to 4.6%. Growth in average hourly earnings is expected to accelerate to 0.3%, while average weekly hours worked is also forecast to rise to 34.4.
After last month’s disappointing report, the April report is important as it will shed some light on whether March was an anomaly or the beginning of a new trend. With such high stakes surrounding the report, the market will likely have a big reaction to the upside or downside based on how the number comes in relative to expectations. To that end, we just published our eleven-page monthly preview for the April jobs report. This report contains a ton of analysis related to how the equity market has historically reacted to the monthly jobs report, as well as how secondary employment-related indicators we track looked in September. We also include a breakdown of how the initial reading for September typically comes in relative to expectations and how that ranks versus other months.
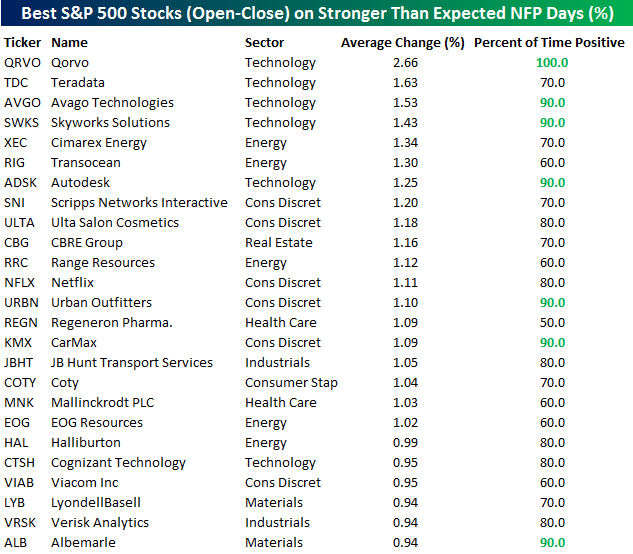
One topic we cover in each month’s report is the S&P 500 stocks that do best and worst from the open to close on the day of the employment report based on whether or not the report comes in stronger or weaker than expected. In other words, which stocks should you buy, and which should you avoid? The table below highlights the best-performing stocks in the S&P 500 from the open to close on days when the Non-Farm Payrolls report has been better than expected over the last two years. Of the 25 top performing stocks, eight sectors are represented, as Consumer Discretionary and Technology both lead with six each. Technology, though, is clearly the leader with the four top performing stocks, including Qorvo (QRVO) which has seen an average open-close gain of 2.66% and positive returns every time. Other consistent winners have been AVGO, SWKS, ADSK, URBN, KMX, and ALB.
For anyone with more than a passing interest in how equities are impacted by economic data, this report is a must read. To see the report, sign up for a monthly Bespoke Premium membership now!
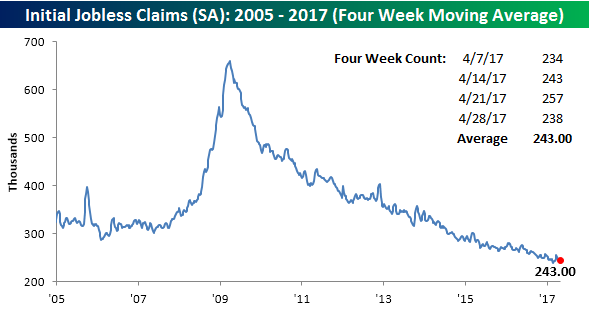
Old Faithful: Jobless Claims
Time and time again throughout the economic recovery there’s been a pattern that whenever it seems as though economic data is showing cracks, jobless claims come in and bail us out. It happened again this week when Jobless Claims dropped by 19K back down to 238K and below the consensus forecast of 248K. This now makes it 113 straight weeks that claims have been below 300K, and as shown in the chart below, the downtrend that has been in place for several months has once again halted an upward move in claims.
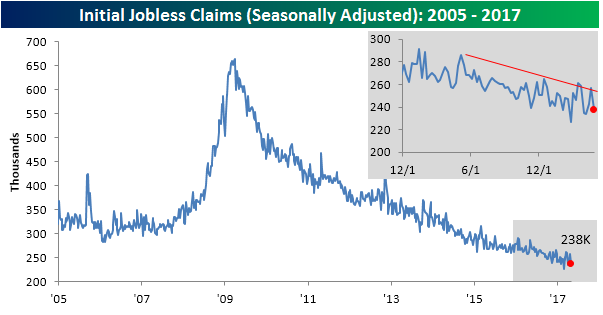
Despite the decline in claims, the four-week moving average actually increased slightly this week, rising from 242.25K up to 243K. That’s still less than 4K off the multi-decade low of 239.75K that we saw ten weeks ago back in February, but it’s going to be a tough slog getting back below that level. However, with claims being as reliable as they have been over the years, we wouldn’t bet against it.
On a non-seasonally adjusted basis, jobless claims fell almost 40K down to 211.3K. For the current week of the year, this is the lowest reading since 1973 and more than 115K below the average of 326.5K for the current week dating back to 2000.

The Closer — Oil Inventories No Catalyst, Alternative Views Of Chinese Credit — 5/3/17
Log-in here if you’re a member with access to the Closer.
Looking for deeper insight on global markets and economics? In tonight’s Closer sent to Bespoke Institutional clients, we review weekly EIA petroleum market data updated today and take an alternative approach to measuring Chinese credit growth.
The Closer is one of our most popular reports, and you can sign up for a free trial below to see it!
The Closer is one of our most popular reports, and you can see it and everything else Bespoke publishes by starting a no-obligation 14-day free trial to our research!