
Q2 2026 Earnings Conference Call Recaps: Micron (MU)
Bespoke’s Conference Call Recaps use AI to summarize lengthy earnings calls. The commentary below is AI-generated and then edited by Bespoke for quality control. As always, none of these summaries should be construed as recommendations to buy or sell any securities, and investors should do their own research and/or consult with a financial professional before making any investment decisions.
Our latest recap available to Bespoke subscribers covers Micron’s (MU) Q3 2026 earnings call.

Micron (MU) is one of the world’s largest manufacturers of memory and storage semiconductors, producing DRAM (volatile working memory), NAND (non-volatile storage) flash, high-bandwidth memory (HBM), and Solid-State Drives (SSDs) used in data centers, PCs, smartphones, vehicles, industrial equipment, and other connected devices. These technologies are what allow computers and other devices to hold data and process information quickly. Micron said AI development is creating more demand for memory chips than the industry can currently produce, and it expects shortages to continue beyond 2027. Data center revenue exceeded $25 billion, sales of storage drives used in data centers more than doubled sequentially to over $5 billion, and shipments of Micron’s newest high-bandwidth memory product, HBM4, which is used alongside advanced AI processors, surpassed $1 billion. Scarce supply and steep price increases lifted gross margin to a record 84.9%, and it expects that figure to reach about 86% next quarter. The company also signed 16 multiyear contracts requiring customers to purchase agreed-upon volumes, giving Micron more predictable demand and protecting profitability if market prices eventually fall. Micron plans to spend roughly $27 billion this year to increase production, but building chip factories takes years and requires specialized workers, regulatory approvals, power infrastructure, and highly complex equipment. This means supply growth will likely stay gradual. The stock rallied about 17% on 6/25 after posting its fifth straight triple play…
Continue reading our Conference Call Recap for MU by becoming a Bespoke Institutional subscriber. You can sign up for Bespoke Institutional now and receive a 14-day trial to read our newest Conference Call Recap. To sign up, choose either the monthly or annual checkout link below:
Bitcoin Gets a 50% Buzz Cut
It always comes back – eventually. Bitcoin is making new multiyear lows today as prices break back below $60K to the lowest level since September 2024. Since the high last fall, prices have been in a steady downtrend in a stairstep pattern lower.
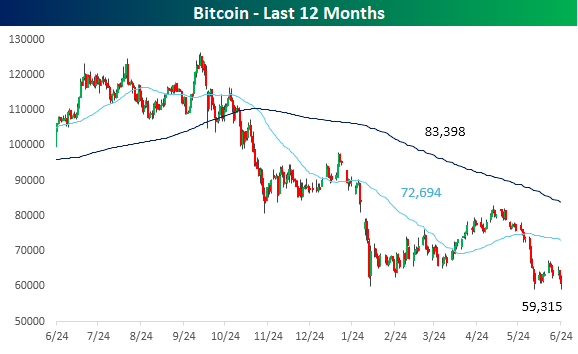
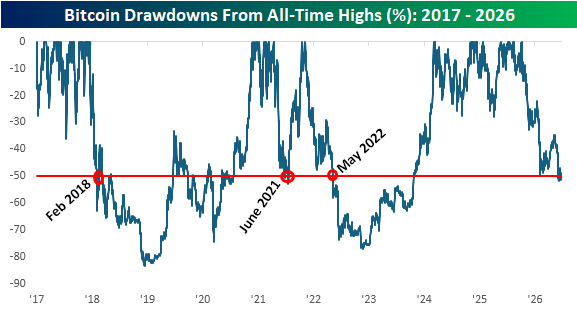
With today’s decline, the current drawdown in Bitcoin has exceeded 50%, a depth it hasn’t reached since late 2023. The chart below shows Bitcoin drawdowns relative to all-time highs dating back to 2007, when its price first closed above $1,000 per coin. This current decline represents the fourth time prices have reached a new record high and then got cut in half, with the last such decline being in May 2022.
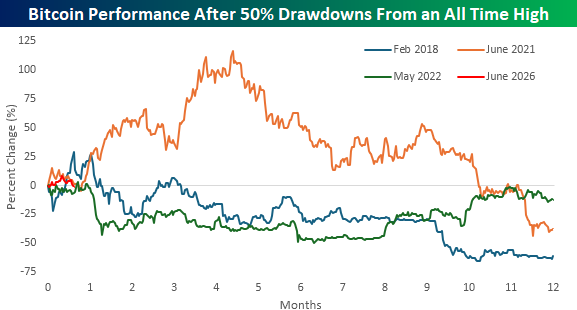
The chart below shows Bitcoin in the year after each of the prior periods when prices first fell 50%+ from an all-time high. One of the things you always hear about Bitcoin after it sees a large decline like the current one is that “prices always come back”. That’s an accurate statement, but after prices experienced a 50% haircut in the three prior periods, the road back to new highs wasn’t necessarily short or smooth.
As shown in the chart, one year after each of the prior three periods, Bitcoin was lower a year later than it was when the drawdown first reached 50%. Not only that, but in two of the three periods, it barely even experienced a bounce. The one exception was after the June 2021 drawdown when prices quickly rebounded to new highs, but almost as quickly returned back to new lows. Perhaps the best thing Bitcoin has working in its favor is that you don’t hear much about $500,000 or even million-dollar price targets anymore.
Want more from Bespoke? You can start by joining our Think BIG mailing list, where you’ll receive an interesting market stat in your inbox a few times per week. All we need is your email address. Join now by clicking here or on the image below.

The Bespoke 50 Growth Stocks – 6/25/26
The “Bespoke 50” is a basket of noteworthy growth stocks in the Russell 3,000. To make the list, a stock must have strong earnings growth prospects along with an attractive price chart based on Bespoke’s analysis. There were no changes to the list this month.
The Bespoke 50 is available with a Bespoke Premium subscription or a Bespoke Institutional subscription. With Bespoke Premium, you’ll receive a number of daily market updates from us along with our weekly newsletter and a portion of our investor tools. With Bespoke Institutional, you’ll receive everything that’s included with Premium plus additional daily macro analysis and more stock-specific research.
To see all 50 stocks that currently make up the Bespoke 50, simply start a two-week trial to Bespoke Premium or Bespoke Institutional.
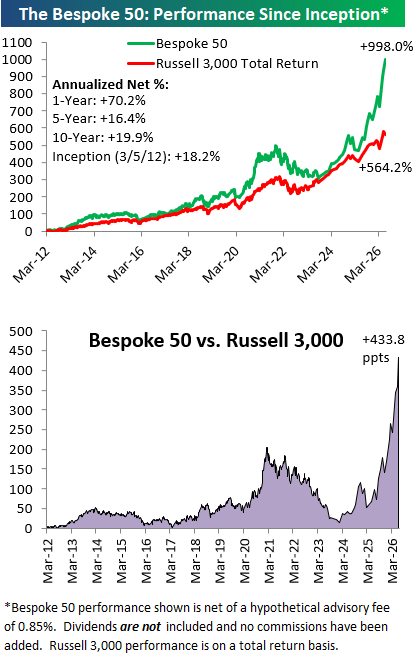
The Bespoke 50 performance chart shown does not represent actual investment results. The Bespoke 50 is updated monthly on Thursdays unless otherwise noted. Performance is based on equally weighting each of the 50 stocks (2% each) and is calculated using each stock’s opening price as of Friday morning after publication. Entry prices and exit prices used for stocks that are added or removed from the Bespoke 50 are based on Friday’s opening price. Any potential commissions, brokerage fees, or dividends are not included in the Bespoke 50 performance calculation, but the performance shown is net of a hypothetical annual advisory fee of 0.85%. Performance tracking for the Bespoke 50 and the Russell 3,000 total return index begins on March 5th, 2012 when the Bespoke 50 was first published. Past performance is not a guarantee of future results. The Bespoke 50 is meant to be an idea generator for investors and not a recommendation to buy or sell any specific securities. It is not personalized advice because it in no way takes into account an investor’s individual needs. As always, investors should conduct their own research when buying or selling individual securities. Click here to read our full disclosure on hypothetical performance tracking. Bespoke representatives or wealth management clients may have positions in securities discussed or mentioned in its published content.
Airlines Exit the Stratosphere
As we discussed in today’s Morning Lineup, across the pond during the European session, travel and leisure names were market leaders. While here in the US travel stocks are being outshined on the session by a still surging AI trade, fueled by strong results from Micron (MU) last night (discussed in last night’s Closer), the group is still performing well. Albeit lower today, the S&P 1500 Hotels, Resorts, and Casinos industry group is up over 9% over the past two weeks, and that pairs with an even higher flying airline industry. Following big gains in the past couple of weeks, the airline industry is now back at record highs.
Looking at the long-term price chart, that break of resistance is significant. Historically, passenger airline stocks have taken years to reclaim prior highs. As shown below, the group peaked in January 2001 and then traded steadily lower throughout the 2000s. After bottoming during the Global Financial Crisis years, the group didn’t reclaim that 2001 high until midway through 2017. Yet still, that breakout was short-lived. The airlines peaked in January 2018, followed by a steep drop two years later at the onset of the pandemic. Impressively, airlines didn’t even return to pre-pandemic (February 2020) levels, let alone the 2018 highs, until earlier this year.
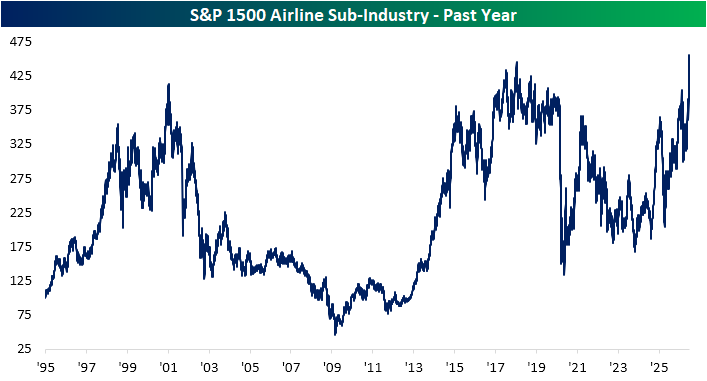
As the saying goes, there are decades where nothing happens, and weeks when decades happen. Having spent years as dead money, airlines have taken a long time to set fresh record highs again. Even legs higher to the upper end of its range have been met with plenty of sizable setbacks. For example, as recently as a few months ago, airline stocks fell over 26% from the February peak to the March low, and it wasn’t until June 12th that they finally moved above the March high. The breakout in the past couple of weeks has only accelerated.
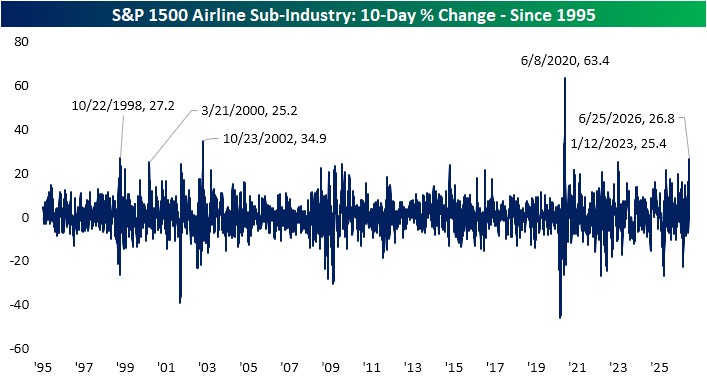
For starters, the group is currently on a five-day winning streak, and as shown below, over the past 10 sessions, it has risen 26.8%. That is one of only a handful of times the group has risen at least 25% in such a span; the most recent other examples being January 2023 and June 2020. Before that, there hasn’t been this sharp a move since October 2002.
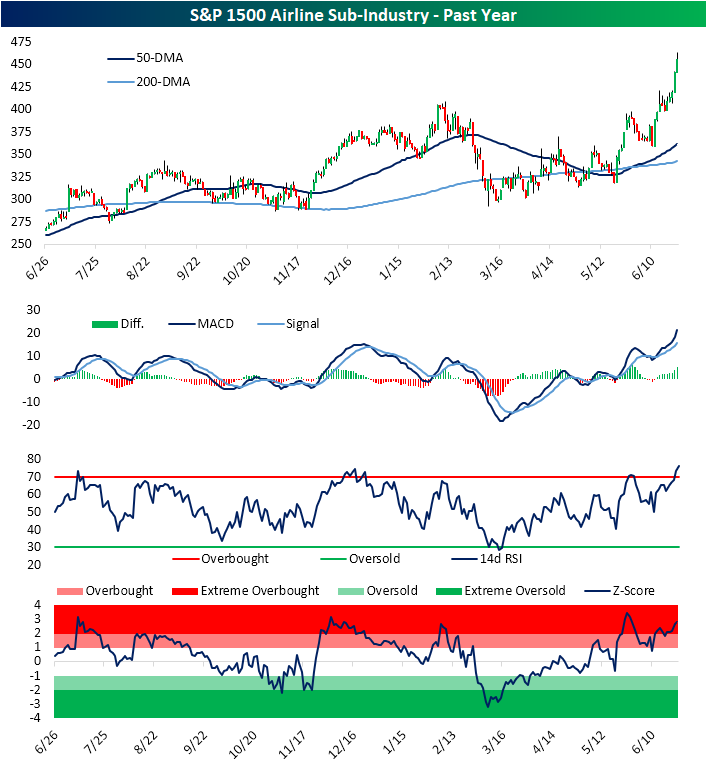
Given airlines have risen with such fervor, the group is now running hot. As shown below, it is deeply overbought, trading 2.8 standard deviations above its 50-DMA. Further, the 14-day RSI is now at the highest level since October 2024 and in the 98th percentile relative to all other periods.
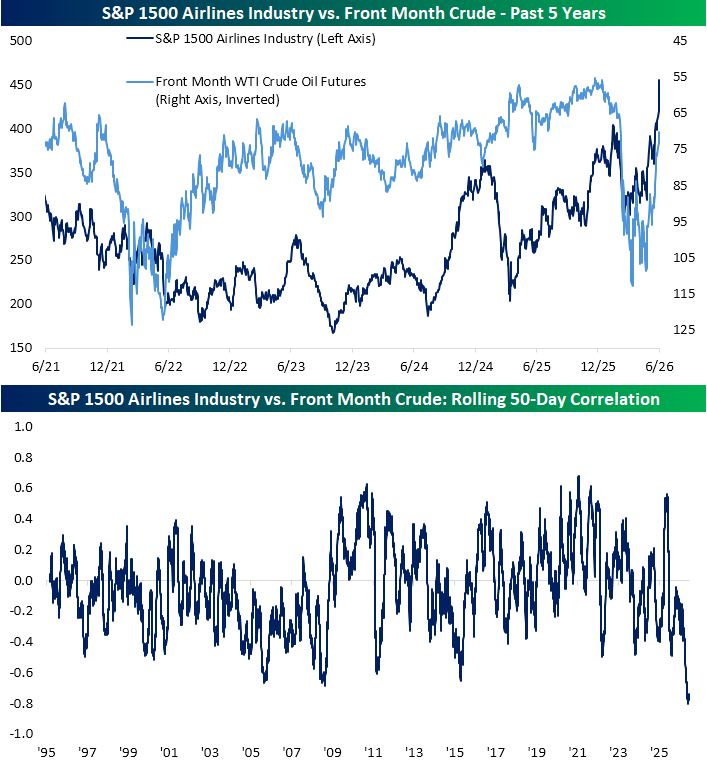
Of course, the airline surge is not completely random. The past two weeks’ rally coincides with positive developments on the war front, which has driven energy prices down. As shown below, this year has seen the price of crude oil almost perfectly mirror the price of airline stocks; a dynamic that has at times been the case in recent years, but not consistently.
The steep rise in Energy prices at the onset of the war also saw airline stocks trade sharply lower, and the reverse moves in the past couple of weeks have also been in lockstep, so much so that the rolling 50-day correlation between the industry and crude prices has been at the strongest inverse levels on record.
Want more from Bespoke? You can start by joining our Think BIG mailing list, where you’ll receive an interesting market stat in your inbox a few times per week. All we need is your email address. Join now by clicking here or on the image below.
Chart of the Day: Bitcoin ETF Buyers Reeling
Bespoke’s Morning Lineup – 6/25/26 – Memory Boost
See what’s driving market performance around the world in today’s Morning Lineup. Bespoke’s Morning Lineup is the best way to start your trading day. Read it now by starting a two-week trial to Bespoke Premium. CLICK HERE to learn more and start your trial.
“Nothing is invented, for it’s written in nature first.” – Antoni Gaudi

Below is a snippet of commentary from today’s Morning Lineup. Start a two-week trial to Bespoke Premium to view the full report.
Futures are higher across the board this morning, and bulls have Micron (MU) to thank after the company reported blowout earnings with strong margins. Gross margins in the quarter were over nearly 85%, and the company guided margins to 86% next quarter. For perspective, the peak quarter of margins for Nvidia (NVDA) during its run was 77.4% in Q1 2025!
In response to the report, Nasdaq futures are poised to open higher by more than 2% while the S&P 500 looks to gain 0.66%. The lift in futures after the close also led to a rally in Asian stocks overnight, which has flowed over to Europe. Despite the big gain in equities, treasury yields are slightly lower, which should help buoy equities. Crude oil prices are down over 1% and have now essentially erased all their Iran war gains. Gold prices are below $4,000, and crypto is attempting to bounce with a gain of 2.6% but is still below $62,000.
It’s been an incredibly busy day for economic data. The revision to Q1 GDP came in higher than expected. Initial Jobless Claims came in lower than expected, while PCE data was mostly inline, so there wasn’t much in the data to disrupt the rally in equities.
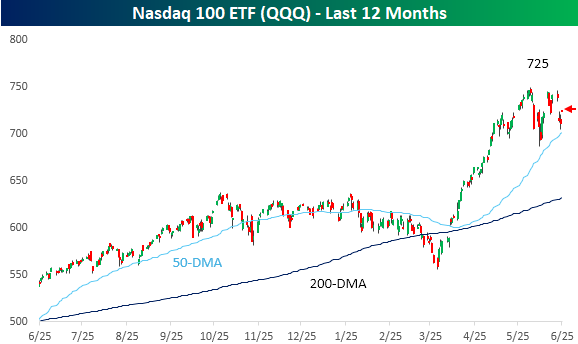
Last night’s earnings results from Micron (MU) have the Nasdaq poised to gap up by roughly 2% at the open, and it comes after another brief dip in which the Nasdaq 100 ETF (QQQ) came close to testing its 50-day moving average (DMA). After the last bounce failed to make a new high, traders will want to see this bounce make a higher high.
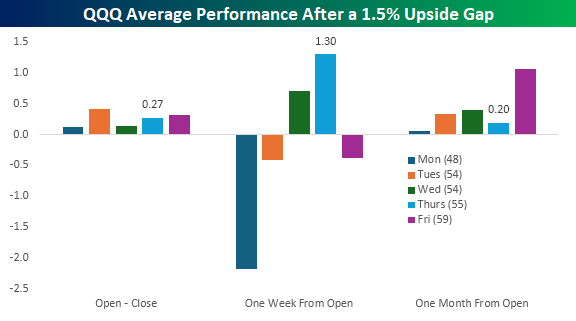
The chart below shows the performance of QQQ following upside gaps of at least 1.5% since 1999. In it, we have broken down returns by the day of the week. On the 55 prior days when QQQ gapped up more than 1.5% on a Thursday, its average return from the open to close was +0.27%. One week from the opening gap, QQQ averaged a gain of 1.3%, which is better than any other day of the week. However, the average 0.20% gain in the month after the prior 1.5% upside Thursday gaps is the second-weakest, trailing only Monday upside gaps.
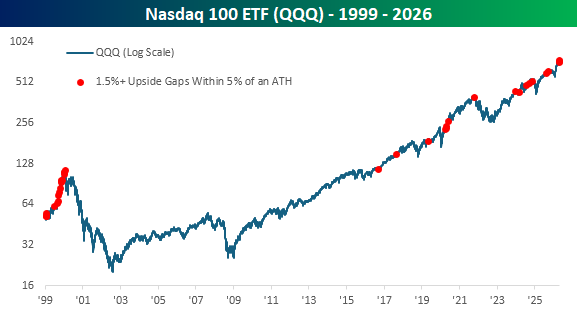
Looking at a long-term chart of QQQ since its inception in 1999, 1.5%+ upside gaps within 5% of an all-time high were frequent in the run-up to the dot-com peak. The frequency obviously dried up after the bubble burst when there wasn’t a new high for more than a decade. Since QQQ first returned to new highs in the last ten years, though, the frequency of these occurrences has been somewhat steady, although the frequency has picked up this month with three occurrences in just the last two weeks.
Start a two-week trial to Bespoke Premium to continue reading today’s full Morning Lineup.
The Closer – Silly Season, Abdicating Leaders – 6/24/26
Log-in here if you’re a member with access to the Closer.
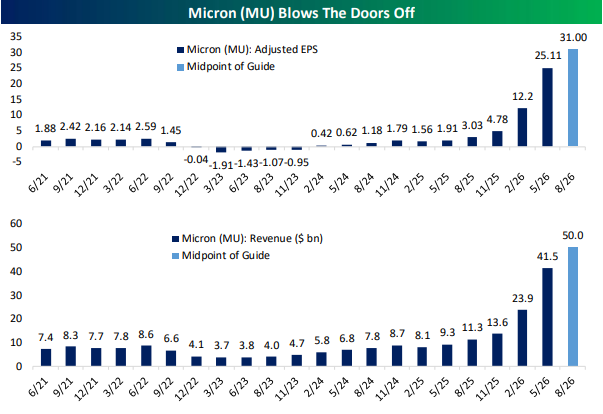
- Micron (MU) earnings showed the company grew revenues 345% YoY with margins rising to 84.9% versus 39% one year ago with resulted in EPS to rise 1,214% YoY.
- Several areas that have been high flying in the past year like mega-caps, Bitcoin, and silver have come under pressure.
- New home sales were expected by economists to rise 3.2% MoM in May but fell 7.3% which takes them to the bottom of the range they’ve occupied for the past several years.
See today’s full post-market Closer and everything else Bespoke publishes by starting a 14-day trial to Bespoke Institutional today!
Daily Sector Snapshot — 6/24/26
Chart of the Day – Alphabet (GOOGL) Joins the Dow
Q2 2026 Earnings Conference Call Recaps: KB Home (KBH)
Bespoke’s Conference Call Recaps use AI to summarize lengthy earnings calls. The commentary below is AI-generated and then edited by Bespoke for quality control. As always, none of these summaries should be construed as recommendations to buy or sell any securities, and investors should do their own research and/or consult with a financial professional before making any investment decisions.
Our latest recap available to Bespoke subscribers covers KB Home’s (KBH) Q2 2026 earnings call.

KB Home (KBH) is one of the largest US homebuilders, focused primarily on first-time and move-up buyers across fast-growing Sun Belt and West Coast markets. Unlike many peers, KBH emphasizes a built-to-order (BTO) model that lets customers choose their lot, floor plan, and finishes before construction begins. The company provides a useful read on US housing affordability, mortgage-rate sensitivity, consumer confidence, land markets, and homebuilding costs. The central message of the quarter was KB Home’s return to its traditional built-to-order strategy. Built-to-order homes represented 73% of second-quarter orders, up from 60% of deliveries, helping grow backlog 26% sequentially while reducing reliance on incentives and speculative inventory. Management described a difficult spring selling season, with March demand hurt by higher mortgage rates, affordability pressures, inflation concerns, and geopolitical uncertainty; however, April improved after pricing adjustments and lower rates. Construction efficiency was a bright spot, with build times falling to 100 days (the fastest in more than a decade) and the company using more than 1,500 sold-but-not-started homes to negotiate costs with trade partners. Looking ahead, management expects sequential improvements in deliveries, revenue, and margins through year-end, aided by a recovering Bay Area business where new high-priced communities are beginning to contribute meaningfully to profits after several years of underperformance. KBH reported better-than-expected revenue but missed the EPS expectation. In reaction to the results, KBH shares rallied more than 15% intraday on 6/24…
Continue reading our Conference Call Recap for KBH by becoming a Bespoke Institutional subscriber. You can sign up for Bespoke Institutional now and receive a 14-day trial to read our newest Conference Call Recap. To sign up, choose either the monthly or annual checkout link below: