S&P 500 Quick View Chart Book: 5/12/17
Each weekend as part of our Bespoke Premium and Institutional research service, clients receive our S&P 500 Quick-View Chart Book, which includes one-year price charts of every stock in the S&P 500. You can literally scan through this report in a matter of minutes or hours, but either way, you will come out ahead knowing which stocks, or groups of stocks, are leading and lagging the market. The report is a great resource for both traders and investors alike. Below, we show the front page of this week’s report which contains price charts of the major averages and ten major sectors.
To see this week’s entire S&P 500 Chart Book, sign up for a 14-day free trial to our Bespoke Premium research service.

ETF Trends: International – 5/12/17
Gold and natural gas continue to outpeform, along with a number of Asian equities; we note that while onshore Chinese equities have undeperformed notably, MCHI, GXC, and FXI all hold Hong Kong-listed offshore equities which have outperformed. EM broadly continues to rally. Worst performers include banks, some European country ETFs (including, surprisingly, France), and a number of US sectors.

Bespoke provides Bespoke Premium and Bespoke Institutional members with a daily ETF Trends report that highlights proprietary trend and timing scores for more than 200 widely followed ETFs across all asset classes. If you’re an ETF investor, this daily report is perfect. Sign up below to access today’s ETF Trends report.
See Bespoke’s full daily ETF Trends report by starting a no-obligation free trial to our premium research. Click here to sign up with just your name and email address.
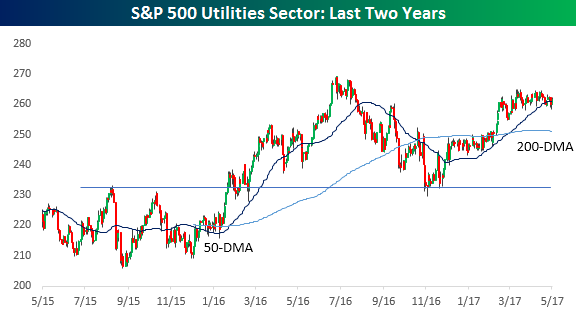
Utilities: Re-Charging For a Breakout?
We don’t talk about the Utilities sector a whole lot, but in putting together our S&P 500 Chart Book this week, there were a number of interesting looking charts in the sector. Given their heavily regulated nature, in many cases, charts of stocks in the Utilities sector often look indistinguishable from one another. Given that, right now we’ll just focus on the chart of the overall sector. After a big run-up in late 2015 through the first half of 2016 on the heels of falling interest rates, the sector fell on some hard times in the second half of 2016. The lows following that sell-off, though, came right after the election when interest rates spiked. You’ll also notice that the decline came to an end right at the previous highs before the late 2015 breakout, and since then it has rebounded nicely. Beginning in late February, however, the sector has been in a sideways range consolidating those gains right below its prior highs. With this sideways range forming a nice base for the sector, any rally from here should be enough to power it right past those prior highs.
If you’re not yet a Bespoke Premium member, start a 14-day free trial to gain access to our full research offering, including our weekly Bespoke Report newsletter.
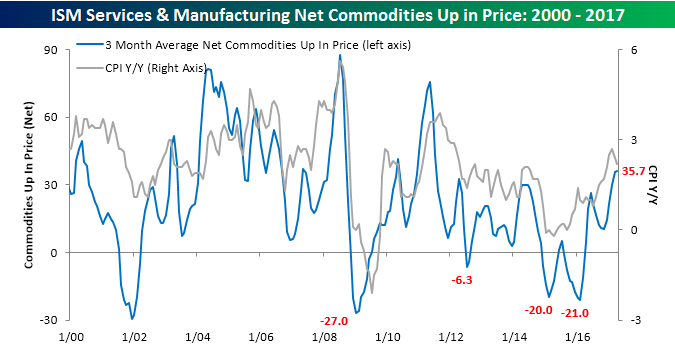
ISM Commodities Survey Diverges From CPI
Today’s CPI report for the month of April showed a smaller than expected increase resulting in a y/y increase in the headline reading of 2.2%. That’s down 0.2 percentage points from last month and down a full half point from the multi-year high of 2.7% that we saw in February. Whenever we look at overall inflation levels, one secondary indicator we like to look at for confirmation of the overall trend is the monthly commodity surveys in the ISM Manufacturing and Non-Manufacturing reports. In a nutshell, these surveys ask respondents about which commodities they deal with are rising and falling in price, and usually, we have found that trends in these surveys tend to coincide or even lead the overall trend in headline inflation. This month, though, we have seen some mixed signals.
With regards to the Manufacturing sector, in this month’s survey respondents noted price increases in 20 commodities and no declines. While twenty is on the high side, it was the lowest monthly reading of the year. In the Services sector, we saw a similar trend. Overall, 16 commodities were up in price and four were down, leaving a net of 12. Adding up the results of both surveys, the net number of commodities rising in price in April was 32, which was down from March’s five-year high of 41.
The chart below compares the three-month moving average of the net number of commodities rising in price compared to the y/y change in CPI. At this month’s level of 36.0, the three-month moving average is at its highest level since July 2011 and has now ticked higher for the fifth straight month, which is the longest monthly streak of increases since July 2015. As shown on the rightmost side of the chart, even as CPI has started to decelerate, the trend in commodity prices has remained higher. This is a trend we wouldn’t expect to continue, and they should both start moving in the same direction. Based on some of the trends we see in the individual monthly data, we would expect to see the trends in the commodities survey start to follow inflation data lower.
If you’re not yet a Bespoke Premium member, start a 14-day free trial to gain access to our full research offering, including our weekly Bespoke Report newsletter.
B.I.G. Tips – Retail Sales: The Hammer Gets Louder
Bespokecast Episode 11 — Pete Najarian — Now Available on iTunes, GooglePlay, Stitcher and More
 We’re happy to announce that the newest episode of Bespokecast is now available to the general public both here and via the various podcast platforms. Be sure to subscribe to Bespokecast on your preferred podcast app to gain access to our full collection of episodes. We’d also love for you to provide a review as well!
In our newest conversation on Bespokecast, we spoke to Pete Najarian, Co-Founder of Investitute. Pete is a long-time contributor on CNBC’s Fast Money and Fast Money Halftime Report, and a financial markets veteran with experience across the options world including the CBOE’s pits where he got his start. Prior to entering the financial industry, Pete played for the Minnesota Golden Gophers in the NCAA and the Tampa Bay Buccaneers and Minnesota Vikings in the NFL. We loved talking to him about his experience playing football, how athletics helped him in the industry, and what he thinks about the future of the game. Our conversation also touched on the skills necessary to have success trading options, some detail on strategies he uses to stay ahead of the market, and the impact of volatility products like VIX-linked ETFs or ETNs on the market for single name equity options. If you’re interested in options, be sure to visit Pete and his brother John’s site — Investitute — where they run their “Unusual Options Activity” service. We learned a lot chatting with Pete, and we hope you enjoy listening!
Each new episode of our podcast features a special guest to talk markets with, and Bespoke subscribers receive access before it’s made available to the general public. If you’d like to try out a Bespoke subscription in order to gain access to these podcasts in advance, you can start a two-week free trial to our research platform. To listen to episode 11 or subscribe to the podcast via iTunes, GooglePlay, OvercastFM, or Stitcher, please click the button or links below.

The Closer — State Growth Broad As Prices Firm — 5/11/17
Log-in here if you’re a member with access to the Closer.
Looking for deeper insight on global markets and economics? In tonight’s Closer sent to Bespoke Institutional clients, we update US GDP growth at the state level. We also discuss strong PPI data reported today.

The Closer is one of our most popular reports, and you can sign up for a free trial below to see it!
The Closer is one of our most popular reports, and you can see it and everything else Bespoke publishes by starting a no-obligation 14-day free trial to our research!
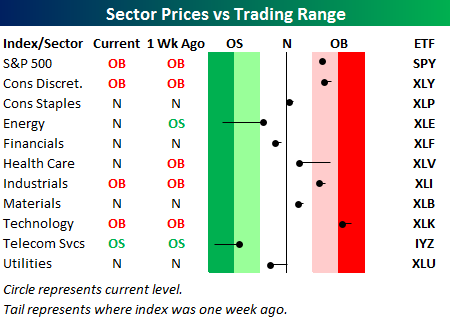
Bespoke’s Sector Snapshot — 5/11/17
We’ve just released our weekly Sector Snapshot report (see a sample here) for Bespoke Premium and Bespoke Institutional members. Please log-in here to view the report if you’re already a member. If you’re not yet a subscriber and would like to see the report, please start a 14-day trial to Bespoke Premium now.
Below is one of the many charts included in this week’s Sector Snapshot, which highlights our trading range screen for the S&P 500 and ten sectors. The black vertical “N” line represents each sector’s 50-day moving average, and as shown, the S&P 500 and six of ten sectors are currently above their 50-DMAs. All six of these sectors, however, moved lower within their trading range over the last week.
To see our full Sector Snapshot with additional commentary plus six pages of charts that include analysis of valuations, breadth, technicals, and relative strength, start a 14-day free trial to our Bespoke Premium package now. Here’s a breakdown of the products you’ll receive.
B.I.G. Tips – It’s About Time: Equities Overtake Treasuries
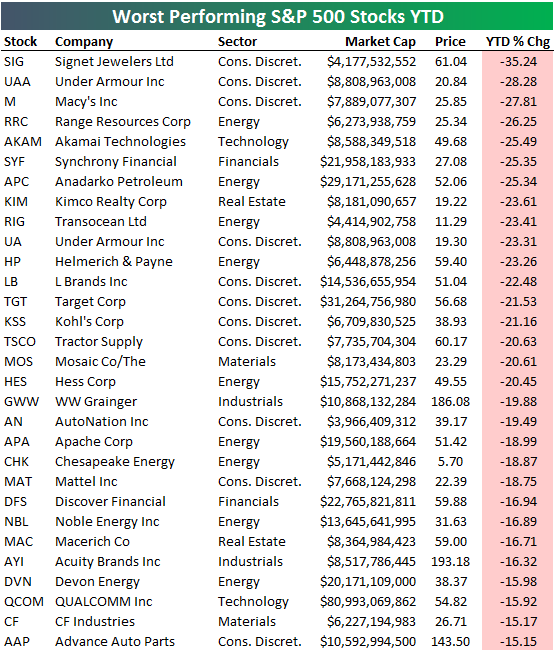
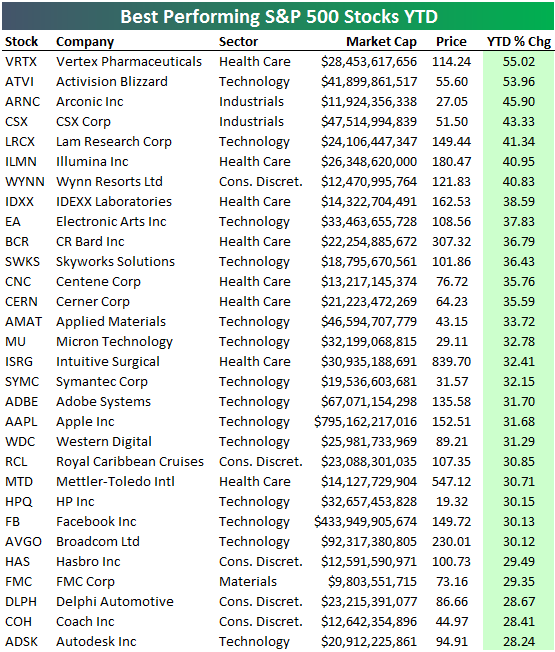
Best and Worst Performing S&P 500 Stocks YTD
The S&P 500 is up nearly 7% year-to-date, but the average stock in the index is up just 5.70%. This means the largest stocks in the cap-weighted index are outperforming the smallest names. Even still, two-thirds of the stocks in the S&P are up year-to-date, while 35% of stocks are up more than 10%. Seventy stocks are up more than 20%, while just 25 are up more than 30%.
Below is a list of the 30 best performing S&P 500 stocks year-to-date. As shown, Vertex Pharma (VRTX) is up the most with a gain of 55%, followed by Activision Blizzard (ATVI), Arconic (ARNC), CSX and Lam Research (LRCX). Wynn Resorts (WYNN) — a Bespoke Model Portfolio name — ranks 7th best with a gain of 40.8%, while Adobe (ADBE) — another Bespoke Model Portfolio name — ranks 18th with a gain of 31.7%. Apple (AAPL) ranks just behind ADBE at 31.68%. As the largest stock in the world with a market cap of just under $800 billion, Apple’s gain this year has been a huge contributor to the cap-weighted S&P 500. Another mega-cap Tech name that’s up more than 30% YTD is Facebook (FB). Coach (COH) may be the most surprising name on the list in the 29th spot given the pain that Retail stocks have gone through. But remember, since Coach is a retailer that has its own brand, it’s not part of our Death By Amazon (DBA) index of retailers that rely mostly on third party brands. That’s where the real pain is.
If you’re not yet a Bespoke Premium member, start a 14-day free trial to gain access to our Death By Amazon index as well as our model stock portfolios.
You can find a number of Death By Amazon index members on the list of worst performing S&P 500 stocks year-to-date, however. Remember, to be part of Bespoke’s DBA index, you have to be a retailer that relies mostly on third party brands. See if you can spot a few of them on the list of 2017’s biggest S&P 500 losers: