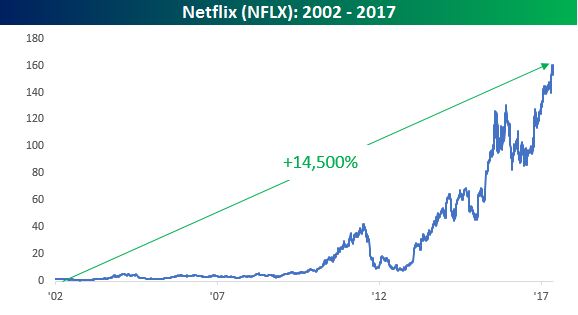
Netflix (NFLX) Celebrates Fifteen Years
Today marks the 15th anniversary of Netflix’s (NXLX) IPO, and while its 14,500% return since going public almost seems puny relative to Amazon (AMZN), at this point in AMZN’s lifetime, it was up “just” 11,400%. Who knows what the next five years will bring for Netflix (NFLX), but whatever you want to say about the company’s stock price, the way the company shifted from mail order to streaming before most of the population even knew what streaming even meant is one of the most noteworthy business decisions of all time.
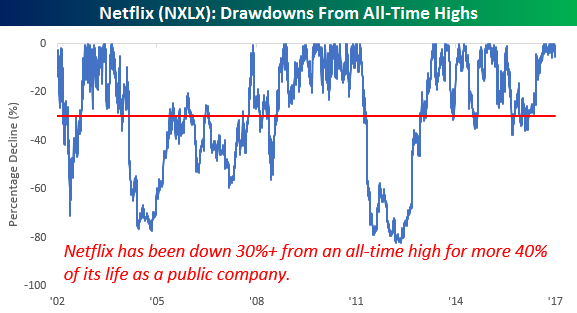
Similar to what we pointed out in our post on AMZN last week, the ride higher for NFLX has been anything but smooth and serves as another lesson for investors that it is never ‘easy’ to buy and hold the biggest winners in the stock market. With big gains usually comes big swings and big risk. Take a look at the chart below which shows NFLX’s historical drawdowns from all-time highs. Including an 82% drop in late 2012, NFLX has been fraught with huge pullbacks. In fact, in its 15 years as a public company, NFLX has been down at least 30% from an all-time high in more than 40% of its time as a public company.
Like what you see? Start a 14-day free trial to Bespoke’s premium research for instant access to our entire suite of offerings.
ETF Trends: Fixed Income, Currencies, and Commodities – 5/22/17
Commodities have rebounded strongly and oil is up 8 of 9 days, pushing commodity-linked ETFs sharply higher over the past week. Austria also continues to outperform while long-term Treasuries have rallied sharply along with precious metals. Underperformers include Brazil and other LatAm ETFs, along with banks, retail, and the US dollar.

Bespoke provides Bespoke Premium and Bespoke Institutional members with a daily ETF Trends report that highlights proprietary trend and timing scores for more than 200 widely followed ETFs across all asset classes. If you’re an ETF investor, this daily report is perfect. Sign up below to access today’s ETF Trends report.
See Bespoke’s full daily ETF Trends report by starting a no-obligation free trial to our premium research. Click here to sign up with just your name and email address.
Oh the Irony — Internationals Outperforming Domestics Since Election
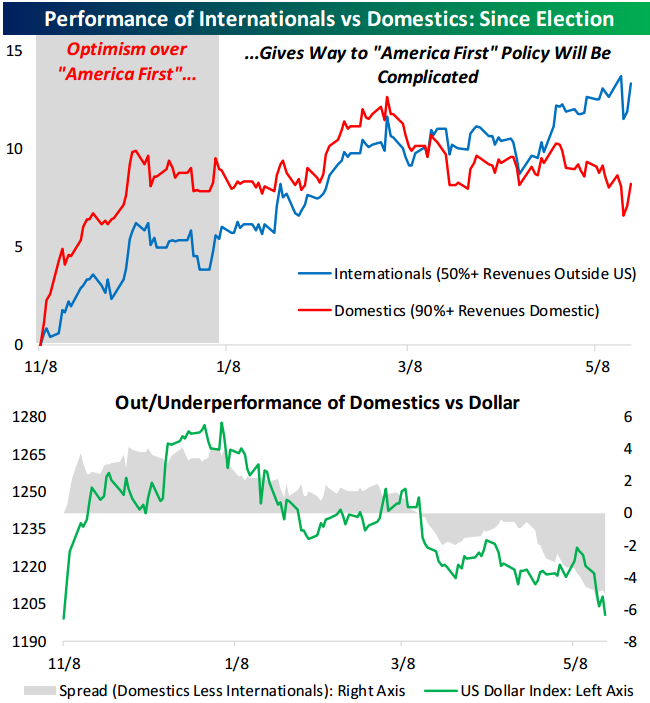
In one of the sections from last Friday’s Bespoke Report newsletter (available to Bespoke’s premium research clients), we featured the chart below looking at the performance of “Internationals” versus “Domestics” since the US Presidential Election last November.
What do we mean by “Internationals” and “Domestics”? The “Internationals” are the stocks in the S&P 500 that generate 50%+ of their revenues outside of the US. The “Domestics” are the stocks in the S&P 500 that generate 90%+ of their revenues domestically.
President Trump campaigned on an “America First” directive when it came to his economic policy proposals. And in the first couple of months following his victory, the S&P 500 stocks with the heaviest domestic exposure outperformed significantly. But since the start of 2017, we’ve seen the “Domestics” trend sideways while the “Internationals” have been the stocks outperforming. The rush into the “Internationals” so far this year has pushed the basket well ahead of the “Domestics” since last November’s Election.
The shift in outperformance from “Domestic” stocks to “Internationals” has tracked the performance of the US Dollar almost perfectly. The Dollar also rallied in the initial months following Trump’s November victory, but it has been trending lower and lower since the start of 2017. When the Dollar is declining, it benefits companies with heavy international revenue exposure. All you have to watch is the direction of the Dollar going forward if you want to know whether the “Domestics” or the “Internationals” are outperforming.
If you want to find stocks that generate a heavy percentage of their revenues either inside or outside of the US, look no further than our International Revenues Database (available to both Bespoke Premium and Bespoke Institutional members). If you’re not a Bespoke Premium or Bespoke Institutional member but would like to try out the database, start a two-week free trial to Bespoke Institutional today.
Revenue Beats Outpacing Earnings Beats
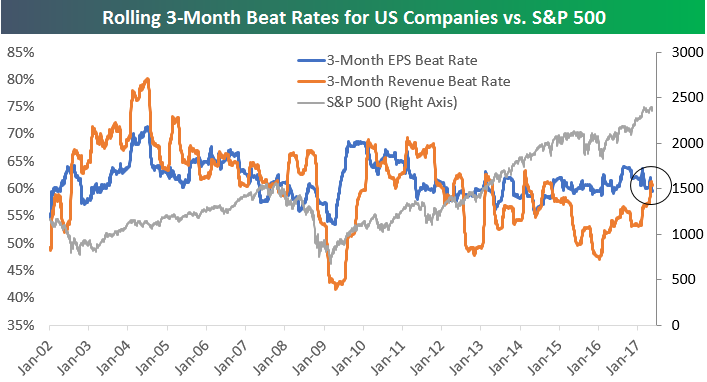
Using our Interactive Earnings Report Database, we’re able to track the trend of earnings (bottom line) and revenue (top line) beat rates over time. By “beat rate” we mean the percentage of companies reporting better than expected (versus consensus analyst estimates) EPS or revenues over a given time period.
In the chart below, we show the rolling 3-month earnings and revenue beat rates over the last 15 years. In the mid-2000s, both top and bottom-line beat rates were generally higher than they are now. During the current bull market that began in March 2009, we initially saw a big spike higher in the earnings beat rate. There was then a drift lower from 2010 through mid-2014, and since then we’ve seen an ever-so-slight uptrend emerge. For the revenue beat rate, we also saw a spike higher in the early days of the bull market, and then it trended lower from 2012 through early 2016. Since the start of 2016, the revenue beat rate has picked up significantly. Just this quarter, we’ve actually seen the revenue beat rate cross above the earnings beat rate, which hasn’t been the case since late 2014.
It’s encouraging to see a strong top-line (revenues) beat rate along with a strong bottom-line (EPS) beat rate because revenue numbers are much more difficult for corporations to manufacture a “beat.” The general trend higher in the revenue beat rate over the last 18 months is bullish in our view.
Start a 14-day free trial to Bespoke’s premium research to see additional earnings season analysis.
Bespoke Brunch Reads: 5/21/17
Welcome to Bespoke Brunch Reads — a linkfest of the favorite things we read over the past week. The links are mostly market related, but there are some other interesting subjects covered as well. We hope you enjoy the food for thought as a supplement to the research we provide you during the week.
Energy
Big energy’s surprise warning: Trump, slow down deregulation by Amy Harder (Axios)
Counter-intuitively, many in the energy industry are opposed to large-scale rollbacks of existing regulation proposed by the current Administration. [Link]
The Big Green Bang: how renewable energy became unstoppable by Pilita Clark (FT)
Investment in renewable energy has reached a tipping point as electric vehicles, wind, and solar draw an ever-larger share of global R&D and physical capex spending. [Link; paywall]
Weird Nature
Great White Shark v Killer Whale: The two deadliest sea titans are now waging war on each other by Warren Manger (The Mirror)
Pods of orcas are hunting great white sharks, which are bigger, faster, and better at coordinating with each other. [Link]
Interview with the scientist who learned how those Death Valley rocks move by themselves by Mark Frauenfelder (BoingBoing)
Mysteriously, rocks in Death Valley have been moving across the desert floor. Now, scientists have discovered the cause. [Link]
Sweet Treats
The “rose doughnut” from this NYC bakery is the newest Instagram obsession by Will Pulos (TimeOut NY)
The newest craze in confectionary is the “rose donut”, a swirl of pastry deep fried and glazed with flavors that include strawberry, rose, and blood orange. [Link]
Girl Scout Troop Leader Is On the Run with $15,000 Worth of Cookies by Nick Rose (Munchies)
A Kentucky woman has been indicted after stealing a huge load of sweet treats which usually help fund troops around the country. There’s no word on which types were included in the load. [Link]
China’s curious cult of the mango by Benjamin Ramm (BBC Magazine)
After re-gifting crate of mangos from the foreign minister of Pakistan to a group of revolutionary workers that stormed Qinghua University (seriously!), mangos became an object of obsession during China’s Cultural Revolution. [Link]
Airlines
Who’s at the Controls on KLM? Sometimes, the Dutch King by Austin Ramzy (NYT)
King Willem-Alexander of the Netherlands (on the throne since 2013) has been flying commercial airline flights for the past two decades, usually incognito. [Link; soft paywall]
Who owns the space between reclining airline seats? (The Economist)
Research over who owns the space airline seats recline into shows how endowment effects can sometimes complicate important economic theory. [Link]
State & Local
World’s first light rail on a floating bridge: For I-90, Sound Transit had to invent ‘a brilliant solution’ by Mike Lindblom (Seattle Times)
If you have any interest in infrastructure, this detailed article on the effort to move light rail across Lake Washington in Seattle is a great read. [Link]
Tennessee makes community college free for all adults by Katie Lobosco (CNN)
In an expansion of a 2014 program, Tennessee is going to spend roughly $10mm per year ensuring basic educational programs in the state are free for any state resident who can make a 2.0 GPA, spend enough time in school to qualify as a part-time student, and complete the FAFSA form. [Link; auto-playing video]
Slavery
My Family’s Slave by Alex Tizon (The Atlantic)
A frankly horrifying story about an American family that kept a slave for over 6 decades. Deeply unsettling to read on every level. [Link]
Editor’s Note: A Reporter’s Final Story by Jeffrey Goldberg (The Atlantic)
Some background about the story linked to above. [Link]
Culture, Haute & Popular
Basquiat Skull Painting Sells for $110.5 Million by Kelly Crow (WSJ)
The work of New York City graffiti artist Basquiat is the hottest in the art world as his 1982 “Untitled” set a price record for an American artist and record for post-1980 artwork this week. [Link; paywall]
The Old Pope by Bryan Curtis (The Ringer)
A history and outlook on Mike Francesa, who has been taking calls and spinning opinion about the sports world for 30 years on WFAN. [Link]
Economic Evidence
Volatility Derivatives in Practice: Activity and Impact by Scott Mixon and Esen Onur (CFTC Office of The Chief Economist)
The CFTC’s chief economist finds that over the 2011-2015 period, changes in flows into and out of VIX futures added 0.5 to 1.0 points to the VIX futures curve; in other words, VIX futures (and by extension VIX ETPs) don’t appear to be distorting the market for volatility significantly. [Link; 52 page PDF]
Why Isn’t Automation Eating Jobs? Greg Ip vs. Ryan Avent by Greg Ip (WSJ)
A wide-ranging conversation on why output per worker hour isn’t rising despite widespread fears of a “rise of the machines”. [Link; paywall]
Benchmarking reflation by Jean Boivin and Rick Rieder (BlackRock)
A very nice piece that argues the current cycle is slow, making it more likely to last a long time; low corporate capex is one factor that plays a role in extending it. [Link; 7 page PDF]
Investors
Alex Rubalcava of Stage Venture Partners: Distinguished Thought Leadership Series (Latticework)
An excellent interview with VC and public market equity investor Alex Rubalcava, whose combination of Munger/Buffett approaches to public market value and a technological cycle-focused approach to VC are fascinating. [Link; 19 page PDF]
Media Matters
Why Do the Big Stories Keep Breaking at Night? by Adrienne Lafrance (The Atlantic)
Publication deadlines for the hardcopy paper are the reason that so many recent political stories have broken in the evening. [Link]
Passing On
Former Paramount head Brad Grey has died at 59 from cancer by Mike Fleming Jr (Business Insider/Deadline)
Grey ran Paramount for 12 years, after acting as executive producer for The Sopranos. [Link]
Drugs
How the FDA Approved a $300,000-a-Year Drug Its Own Experts Didn’t Believe Worked by Susan Pulliam and Brody Mullins (WSJ)
In the battle to gain drug approvals, coordination between patient families and drug companies raises deep questions about the approval process and how companies engage with it. [Link; paywall]
Moar Fyre
Fyre Festival Was Buried Under Millions in Debt Before It Even Began by Polly Mosendz, Kim Bhasin, and Shahien Nasiripour (Bloomberg)
In the last few days before the disastrous Fyre Festival, organizers borrowed millions in a fruitless effort to stave off the inevitable debacle. [Link]
Politics
Even The Biggest Scandals Can’t Kill Party Loyalty by Julia Azari, Perry Bacon Jr. and Harry Enten (538)
Prior major political scandals (Watergate, Iran-Contra, and the Clinton impeachment) typically don’t sway the supporters of the embattled political party in question, making high approval ratings from Republicans during recent controversy around the FBI for President Trump a normal occurrence rather than an outlier. [Link]
Have a great Sunday!
The Closer 5/19/17 – End of Week Charts
Looking for deeper insight on global markets and economics? In tonight’s Closer sent to Bespoke clients, we recap weekly price action in major asset classes, update economic surprise index data for major economies, chart the weekly Commitment of Traders report from the CFTC, and provide our normal nightly update on ETF performance, volume and price movers, and the Bespoke Market Timing Model. This week, we’ve added a section that helps break down momentum in developed market foreign exchange crosses.

The Closer is one of our most popular reports, and you can sign up for a free trial below to see it!
Click here to start your no-obligation two-week free Bespoke research trial now!
The Bespoke Report Newsletter: 5/19/17 – Crime, Corruption, and Coups
S&P 500 Quick View Chart Book — 5/19/17
B.I.G. Tips – Q1 2017 Earnings Season Summary
Earnings Beats, Misses and Price Reactions
A total of 2,450 companies reported earnings during the just-completed first quarter earnings season. Of these 2,450 reports, exactly 1,500 of them reported better than expected EPS numbers. That’s a 61.2% earnings “beat” rate.
Below is chart that shows the one-day stock price reaction for every single earnings beat, miss, or inline report this season. As you know, not all “beats” translate into price gains, but on average, the stocks that beat EPS estimates this season gained 1.97% on their earnings reaction days.
While 61.2% of companies beat EPS estimates, 29.8% missed estimates, and these stocks averaged a one-day decline of 3.21% on their earnings reaction days. Given that misses are much less common than beats, it makes sense that stock prices get hit harder on a miss than they gain on a beat.
Finally, 9% of companies reported inline EPS this season. In this day and age where companies are pressured to “beat the quarter,” it should come as no surprise that the average stock that reported inline EPS fell in reaction to the news. As shown in the chart, the average stock that reported inline numbers fell 1.59% on its earnings reaction day.
Start a 14-day free trial to Bespoke’s premium research to see additional earnings season analysis.
