Jobless Claims Channeling 1973
Jobless claims came in lower than expected this week, marking the fourth straight week of better than expected readings. The last time we saw a streak this long was last October when claims came in lower than expected for nine straight weeks. While economists were expecting claims to come in at a level of 238K, the actual reading came in at 234K, marking the fourth straight week where claims were below 240K. You know when that happened last? 1973!
Start a two-week free trial to Bespoke Institutional today.
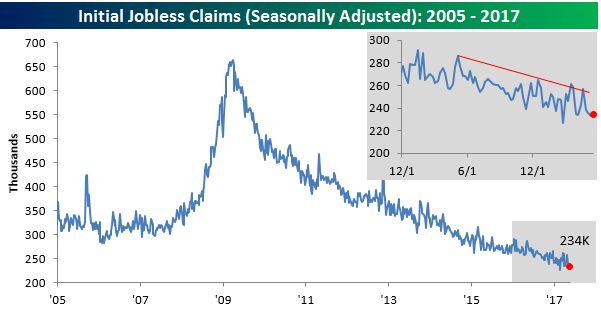
With this week’s lower than expected reading in claims, the four-week moving average also crossed a new milestone, falling from 241K down to 235.25K. That marks a new cycle low and is the lowest reading for the four-week moving average since…you guessed it – 1973!

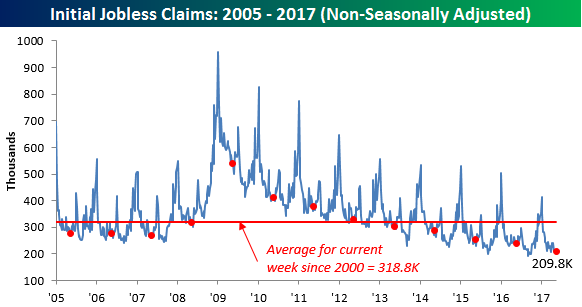
On a non-seasonally adjusted basis (NSA), jobless claims actually rose slightly from 207K up to 209.8K. Despite the increase, though, this week’s level was still more than 100K below the average for the current week of the year dating back to 1973. In fact, to find a reading for the current week of the year where NSA claims were lower, you have to go back to – wait what was that year again? Oh right- 1973.
Bulls Out of the Majority For 125 Straight Weeks
After the largest one-week decline in bullish sentiment in over a year last week, investors stepped away from the ledge this week and became a bit less pessimistic. In the latest sentiment figures from AAII, bullish sentiment rebounded from 23.9% up to 32.9% this week. While the bounce erased all of last week’s decline, it is still notable that less than one-third of investors polled in this survey consider themselves bullish, even with the S&P 500 at all-time highs. Further, it’s been a record 125 weeks now since the bulls were last in the majority.
Start a two-week free trial to Bespoke Institutional today.
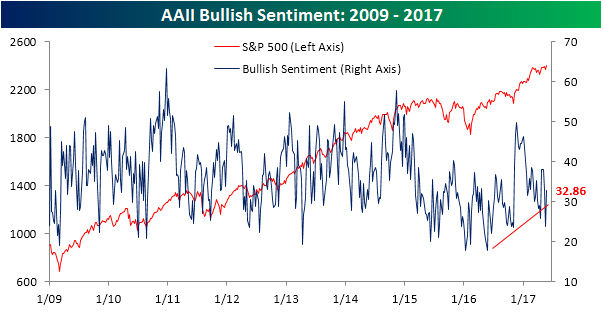
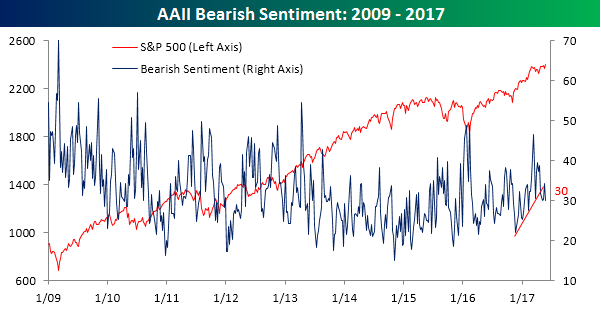
Bearish sentiment, meanwhile, dropped slightly more than it increased last week, falling from 34.25% down to 30%. After trending higher since late 2016, bearish sentiment looks like it may have finally broken that uptrend in the last few weeks.
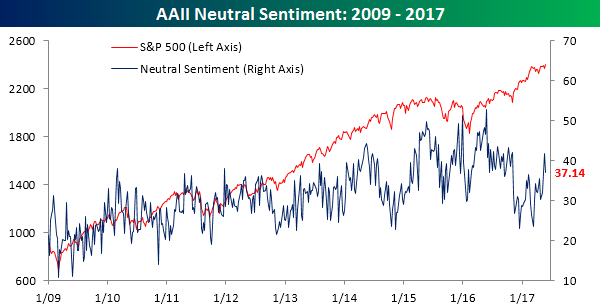
Finally, after surging back above 40% for the first time this year last week, neutral sentiment drifted back below 40% to a level of 37.14%.
the Bespoke 50 — 5/25/17
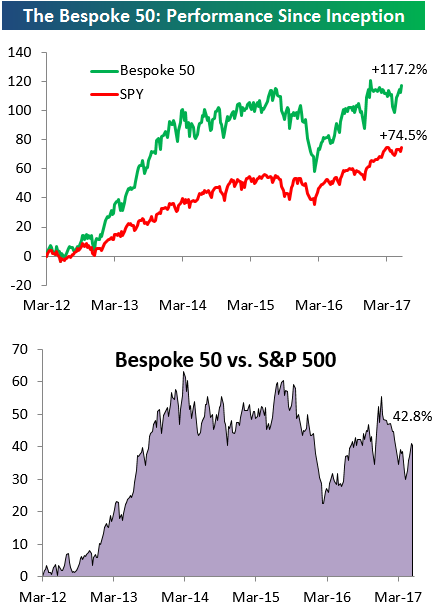
Every Thursday, Bespoke publishes its “Bespoke 50” list of top growth stocks in the Russell 3,000. Our “Bespoke 50” portfolio is made up of the 50 stocks that fit a proprietary growth screen that we created a number of years ago. Since inception in early 2012, the “Bespoke 50” has beaten the S&P 500 by 42.8 percentage points. Through today, the “Bespoke 50” is up 117.2% since inception versus the S&P 500’s gain of 74.5%. Always remember, though, that past performance is no guarantee of future returns.
To view our “Bespoke 50” list of top growth stocks, sign up for Bespoke Premium ($99/month) at this checkout page and get your first month free. This is a great deal!
The Closer — Rolloff Rolling On, Consumer Credit Charts — 5/24/17
Log-in here if you’re a member with access to the Closer.
Looking for deeper insight on global markets and economics? In tonight’s Closer sent to Bespoke Institutional clients, we recap the Fed Minutes release from this afternoon before diving into some unique statistics on consumer credit including student loans and autos.

The Closer is one of our most popular reports, and you can sign up for a free trial below to see it!
The Closer is one of our most popular reports, and you can see it and everything else Bespoke publishes by starting a no-obligation 14-day free trial to our research!
Top Earnings Season Triple Plays — 5/24/17
Here at Bespoke, our job is to identify winners and losers, and one of the ways we try to find earnings-season winners is through our list of “triple plays.”
Long-term Bespoke subscribers know how much we like triple plays, but for those that haven’t heard of the term, we came up with it back in the mid-2000s for companies that beat analyst earnings estimates, beat analyst revenue estimates and also raise guidance. Investopedia.com is one of the best online resources for financial markets education, and they’ve actually given us credit for coining the “triple play” term on their website. We consider triple play stocks to be the cream of the crop of earnings season, and we are constantly finding new long-term buy opportunities from this basket of names each quarter.
There were a total of 102 “triple plays” this past season out of roughly 2,400 earnings reports. Throughout earnings season, Bespoke sends Premium and Institutional members its “Earnings Triple Plays Report.” The report keeps a running tally of recent triple plays, and it also provides a list of “Top Triple Plays.” We’ve just published our final Earnings Triple Plays Report for the recently-ended earnings season, featuring a list of the 19 triple-play stocks that we’ve identified as having the most attractive chart patterns. Learn how to see the stocks below!
See our Top Earnings Season Triple Plays by signing up for a monthly Bespoke Premium membership now. Click this link for a 14-day free trial.
Chart of the Day: S&P 500 Cumulative A/D Line Hits a New High
Fixed Income Weekly – 5/24/17
Searching for ways to better understand the fixed income space or looking for actionable ideals in this asset class? Bespoke’s Fixed Income Weekly provides an update on rates and credit every Wednesday. We start off with a fresh piece of analysis driven by what’s in the headlines or driving the market in a given week. We then provide charts of how US Treasury futures and rates are trading, before moving on to a summary of recent fixed income ETF performance, short-term interest rates including money market funds, and a trade idea. We summarize changes and recent developments for a variety of yield curves (UST, bund, Eurodollar, US breakeven inflation and Bespoke’s Global Yield Curve) before finishing with a review of recent UST yield curve changes, spread changes for major credit products and international bonds, and 1 year return profiles for a cross section of the fixed income world.
In this week’s note, we take a look at spreads between other global government bond yields and US Treasuries.
Our Fixed Income Weekly helps investors stay on top of fixed income markets and gain new perspective on the developments in interest rates. You can sign up for a Bespoke research trial below to see this week’s report and everything else Bespoke publishes free for the next two weeks!
Click here to start your no-obligation free Bespoke research trial now!
ETF Trends: Hedge – 5/24/17
Metals and mining have quietly bounced and lead ETFs we track over the last 5 days, with oil, Austria, and emerging markets also doing well. Brazil remains an underperformer despite it’s 10% bounce from the open last Thursday. Gold miners, India, and retail have all underperformed.

Bespoke provides Bespoke Premium and Bespoke Institutional members with a daily ETF Trends report that highlights proprietary trend and timing scores for more than 200 widely followed ETFs across all asset classes. If you’re an ETF investor, this daily report is perfect. Sign up below to access today’s ETF Trends report.
See Bespoke’s full daily ETF Trends report by starting a no-obligation free trial to our premium research. Click here to sign up with just your name and email address.
The Closer — New Home Sales: More Starts Ahead — 5/23/17
Log-in here if you’re a member with access to the Closer.
Looking for deeper insight on global markets and economics? In tonight’s Closer sent to Bespoke Institutional clients, we review new home sales data updated today by the US Census, Richmond Fed Manufacturing and Services data, global Flash PMIs from Markit, and a series of data releases today from Brazil and Mexico.
The Closer is one of our most popular reports, and you can sign up for a free trial below to see it!
The Closer is one of our most popular reports, and you can see it and everything else Bespoke publishes by starting a no-obligation 14-day free trial to our research!
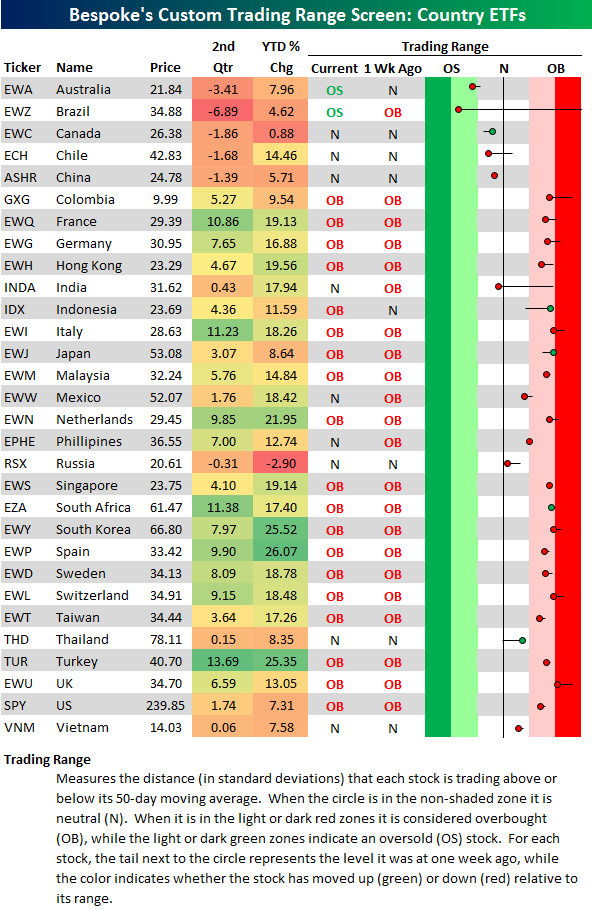
Most of World Still Overbought
Below is an updated look at our country trading range screen, which gives viewers a quick look at where global equity markets are trading within their normal ranges. The screen includes ETFs for 30 of the largest country equity markets. The black vertical “N” line represents each ETF’s 50-day moving average, and moves into the red or green zones are considered overbought or oversold.
As you can see, the majority of country ETFs are trading in overbought territory, but most overbought countries are slightly lower today than they were a week ago at this time. The big movers to the downside over the last week have been Brazil (EWZ) and India (INDA). Last week at this time, Brazil was the most overbought country in the world, while now it’s the most oversold. India was overbought as well last week at this time, but over the past five trading days it has actually moved below its 50-day moving average.
In terms of price performance, France (EWQ), Italy (EWI), South Africa (EZA), and Turkey (TUR) have done the best so far in Q2, while Brazil (EWZ), Australia (EWA), and Canada (EWC) have done the worst.
Start a two-week free trial to Bespoke Institutional today.