the Bespoke 50 — 6/8/17
Every Thursday, Bespoke publishes its “Bespoke 50” list of top growth stocks in the Russell 3,000. Our “Bespoke 50” portfolio is made up of the 50 stocks that fit a proprietary growth screen that we created a number of years ago. Since inception in early 2012, the “Bespoke 50” has beaten the S&P 500 by 47.2 percentage points. Through today, the “Bespoke 50” is up 124.0% since inception versus the S&P 500’s gain of 76.8%. Always remember, though, that past performance is no guarantee of future returns.
To view our “Bespoke 50” list of top growth stocks, sign up for Bespoke Premium ($99/month) at this checkout page and get your first month free. This is a great deal!

Jobless Claims Disappoint Again
After four straight weeks where jobless claims came in lower than forecast, we have now seen two straight weeks where jobless claims have disappointed to the upside. Last week, claims came in 10K ahead of forecasts and today’s report showed claims coming in 5K higher than expected. While economists were forecasting claims to fall back down to 240K, the actual reading came in at 245K, which was down 10K from last week’s reading of 255K. Despite the higher than expected reading, claims have now been below 300K for 118 straight weeks.
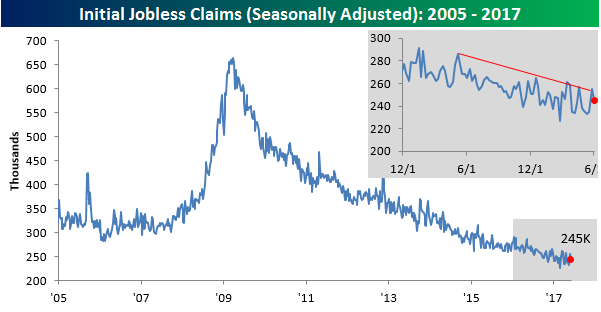
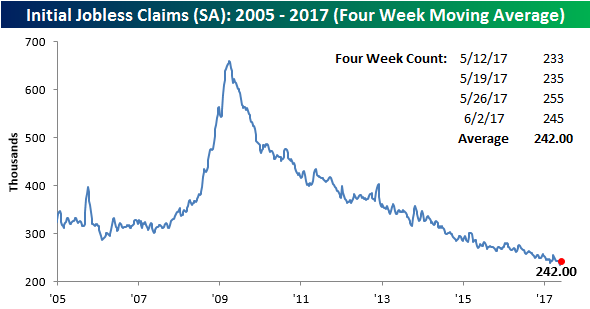
Heading into last week’s report, we were expecting the four-week moving average to make a new cycle low, but the higher than expected reading quashed that plan, and with this week’s reading of 245K, it is unlikely that we will see a new low in claims anytime soon. To get there, the four-week moving average would need to drop down to 235.5K from the current level of 242K. That doesn’t sound like a lot, but in the next two week’s we will be dropping readings in the low 230K range, so the four-week moving average is likely to drift higher.
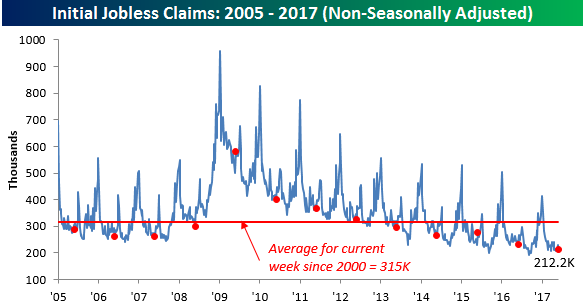
On a non-seasonally adjusted (NSA) basis, claims fell from 231.6K down to 212.2K. For the current week of the year, this is more than 100K below the average going back to 2000 and the lowest for this specific week since 1974.
Bullish Sentiment Back on the Upswing
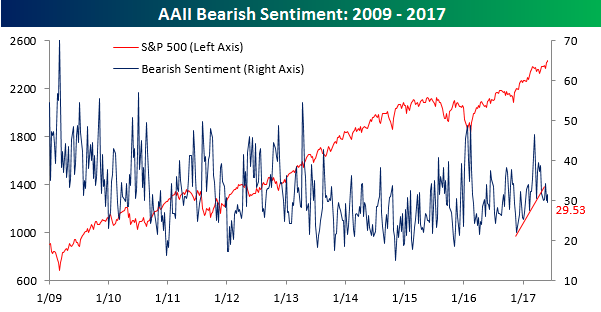
With everything seemingly okay in the equity world again after the major averages all hit new highs to close out last week, individual investors turned more bullish in the latest week. According to the monthly survey from AAII, bullish sentiment increased from a very depressed level of 26.92% up to a five week high of 35.43%. While it’s a far ways from a majority (a level we haven’t seen now in a record 127 straight weeks), this is the first time bulls have been in the plurality in five weeks.
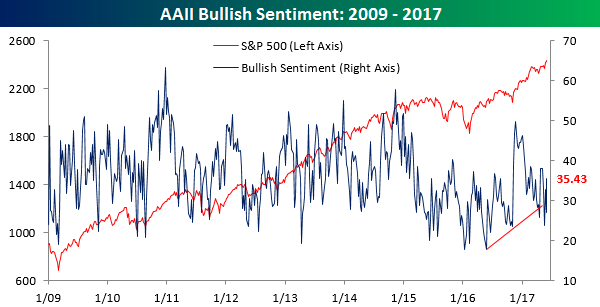
Although bullish sentiment increased, bearish sentiment only saw a modest decline. As shown in the chart below, negative sentiment declined by just two percentage points but did manage to fall back below 30%. Also, that uptrend that had been in place since the lows in late 2015 appears to have been broken.
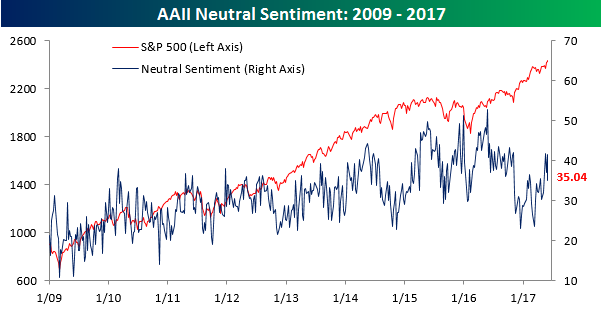
With bullish sentiment on the rise and bearish sentiment barely budging, the neutral camp really shrunk this week falling from above 40% down to 35%.
The Closer — Crude Crumpled — 6/7/17
Log-in here if you’re a member with access to the Closer.
Looking for deeper insight on global markets and economics? In tonight’s Closer sent to Bespoke Institutional clients, we take a look at the EIA’s weekly petroleum market report.

The Closer is one of our most popular reports, and you can sign up for a free trial below to see it!
The Closer is one of our most popular reports, and you can see it and everything else Bespoke publishes by starting a no-obligation 14-day free trial to our research!
Nasdaq 100 Versus 2000 Dot Com Peak
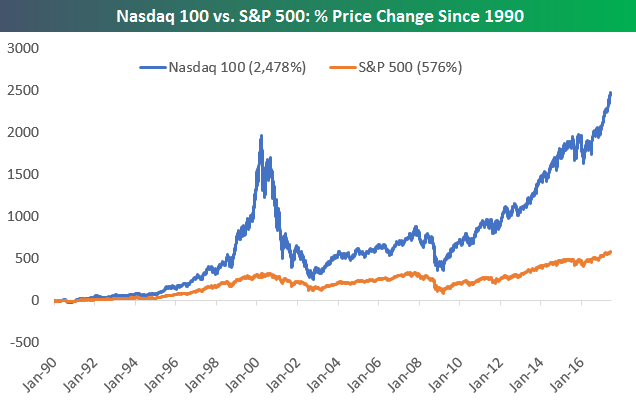
The Tech-heavy Nasdaq 100 is up more than 20% year-to-date, and as shown in the chart below, the index is now 24.8% above its Dot Com bubble peak hit on March 27th, 2000. In the mid to late 2000s, there were plenty of investors that thought they wouldn’t live to see the Nasdaq take out its Tech-bubble highs, but the index’s surge over the last year has made it a reality.
While the Nasdaq 100’s chart looks pretty gorgeous right now, we can’t help but wonder when the next downturn will come. Remember, stocks do go down sometimes!

Since 1990, the Nasdaq 100 is up nearly 5x as much as the S&P 500 in terms of simple price appreciation. Talk about outperformance.
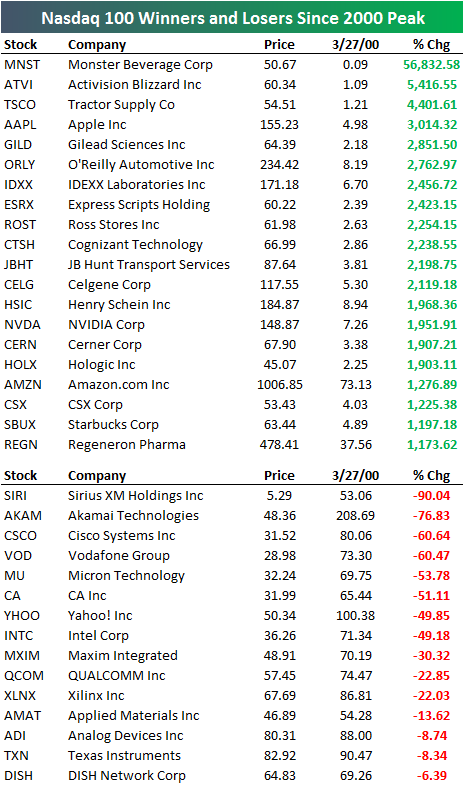
Below is a look at the best and worst performers in the Nasdaq 100 (current members) since the Dot Com peak on March 27th, 2000. One fifth of the index is up more than 1,000% since those prior highs, including names like Apple (AAPL), NVIDIA (NVDA), Amazon.com (AMZN), and Starbucks (SBUX).
Even more interesting to us is that 15 stocks in the index still haven’t taken out their Dot Com bubble highs. Stocks like Cisco (CSCO), Yahoo! (YHOO), and Intel (INTC) are all still 50%+ below their 3/27/00 price levels.
Non Farm Payrolls: An Outlier for May Employment Data
Leading up to each month’s Non-Farm Payrolls (NFP) report, we always like to look at a variety of secondary employment-related indicators for a sign of what we might be able to expect from the main report. Because this month’s payrolls report fell on the second day of the month, a number of the secondary indicators weren’t released until after the actual report. However, in the accompanying table, we put together a compilation of them to show how they changed between April and May.

After last Friday’s NFP report, we came across a number of stories suggesting that the miss in headline Non-Farm Payrolls was leading to skepticism on the part of investors regarding additional rate hikes following a widely expected hike in June. According to a Bloomberg story, “investors increasingly doubt the central bank’s projection for additional hikes following soft reports on U.S. employment and inflation.” What was puzzling about this line of reasoning was that despite the weaker than expected headline reading in Non-Farm Payrolls, every other indicator we tracked in our table to the right was either inline with or ahead of expectations. Additionally, in the cases of ADP Private Payrolls and the Employment component of the ISM Services report, the margin of upside surprise was actually quite strong. In fact, in May’s ISM Services report, the Employment component printed its fifth highest level in the history of the report (since 1997) and the best single month in nearly two years (July 2015). Yes, NFP was on the weak side, but with every other indicator coming in inline or to the upside, it’s hard to call the labor market soft. Also, keep in mind that this table didn’t include the most recentl JOLTS report for April which hit an all-time high.
Bespoke Summary of Economic Indicators: 6/7/17
Chart of the Day: Economic Indicator Diffusion Index Trying to Stabilize
Fixed Income Weekly – 6/7/17
Searching for ways to better understand the fixed income space or looking for actionable ideals in this asset class? Bespoke’s Fixed Income Weekly provides an update on rates and credit every Wednesday. We start off with a fresh piece of analysis driven by what’s in the headlines or driving the market in a given week. We then provide charts of how US Treasury futures and rates are trading, before moving on to a summary of recent fixed income ETF performance, short-term interest rates including money market funds, and a trade idea. We summarize changes and recent developments for a variety of yield curves (UST, bund, Eurodollar, US breakeven inflation and Bespoke’s Global Yield Curve) before finishing with a review of recent UST yield curve changes, spread changes for major credit products and international bonds, and 1 year return profiles for a cross section of the fixed income world.
In this week’s note, we discuss the move lower in ten year yields as a function of the market’s expectation for Fed policy.
Our Fixed Income Weekly helps investors stay on top of fixed income markets and gain new perspective on the developments in interest rates. You can sign up for a Bespoke research trial below to see this week’s report and everything else Bespoke publishes free for the next two weeks!
Click here to start your no-obligation free Bespoke research trial now!
ETF Trends: US Indices & Styles – 6/7/17
Gold miners have spiked over the last week, outperforming all other ETFs we tracking. Oil, on the other hand, continues to get hit hard with USO, DBE, and DBO all on top of our worst performers list. Huge builds in inventories and products in today’s EIA report on the US petroleum market are helping the cause. Other good performers of late have included Mexico, Japan, biotech, and some small cap indices. Commodities in general continue to underperform; base metals, broad commodity indices, and natural gas.

Bespoke provides Bespoke Premium and Bespoke Institutional members with a daily ETF Trends report that highlights proprietary trend and timing scores for more than 200 widely followed ETFs across all asset classes. If you’re an ETF investor, this daily report is perfect. Sign up below to access today’s ETF Trends report.
See Bespoke’s full daily ETF Trends report by starting a no-obligation free trial to our premium research. Click here to sign up with just your name and email address.