The Bespoke Report – 6/9/17 – Lots of Light, Less Heat
Below is an excerpt from our weekly Bespoke Report, just sent to subscribers.
- Both sides of the Atlantic were abuzz this week with political headlines: a former FBI director took the stand in Washington to call the President a liar, while a shocking election result in the UK sent the pound sterling tumbling and threw the entire country into political flux while the ticking clock of Article 50 is running.
- For all that political heat, XIV (the inverse short-term VIX futures ETF) has outperformed SPY by almost 50% YTD (chart, right).
- The VIX has been below 16 for 145 straight closes through Thursday, the third-longest such streak on record, and hit its lowest levels since 2006 on Friday.
- An equal-weighted portfolio that should perform well in a “good policy” environment (short ten year notes, long the dollar, and long equities) has moved sideways almost all year long.
- In other words, despite a raucous period for society, the markets are tame and docile.
- That’s a scenario we’ve been mulling for quite some time; the reaction from global equity markets following Brexit was an early sign of that regime, as was the equity market’s significant rally in 2016 following the US election.
- Back in March, we highlighted the steady grind higher in the stock market during the tumultuous year of 1964, when Goldwater ran for President, the Civil Rights Act became law, Vietnam was heating up, and LBJ introduced his ’Great Society’ initiatives.
- In the background of the light from political disruption is the economy: after the entire world got onto the same page of upside surprises in Q1, American data has deteriorated.
- Investors are forced to ask: is the political light distracting from weak data here in the USA?
If you’d like to read our thoughts on recent performance plus the rest of this week’s Bespoke Report newsletter, take advantage of our one-month Bespoke Premium free trial offer. Sign up now at this page.
Have a great weekend!

How Does the Current Rally Stack Up?
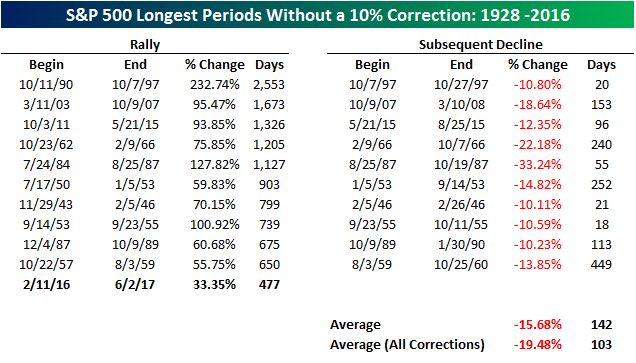
Ever since last February’s “Dimon Bottom” where JP Morgan CEO Jamie Dimon’s purchase of stock in his bank has come to symbolize the low of the late 2015/early 2016 market sell-off, US equities have been on a practically uninterrupted run higher. While there have been bumps along the way, the S&P 500 hasn’t seen a 10% correction at any time in the last 16 months, rallying more than 33%. With the current rally lasting 477 calendar days, it ranks as the eleventh longest run in the S&P 500 without a 10% correction since 1928. In the table below, we list each of the ten longest rallies without a correction as well as how much the S&P 500 declined in the following correction.
If the current rally is going to crack the top ten, it has a lot of work to do on the upside. At 477 days, the S&P 500 would need to go another 173 days before reaching a short-term peak. That would take the current run past Thanksgiving! Another thing to note is that just as the ten prior rallies lasted much longer, they were also considerably stronger. In fact, the average and median gain during the ten prior rallies that went longer without a correction was more than 90%! Looking ahead, you would think that the harder they run, the harder they fall. In actuality, though, the average decline in the correction that followed the ten prior rallies was a decline of 15.7% over 142 days. Compared to all corrections since 1928 where the average decline was 19.5%, these corrections may have lasted longer but their intensity was not as strong.
Finally, how overdue are we for a correction? Since 1928, there have been 95 10%+ corrections for the S&P 500. While corrections tend to come at irregular intervals, that works out to about one every eleven months. That would make the S&P 500 currently about six months overdue for a correction.
S&P 500 Quick View Chart Book: 6/9/17
Each weekend as part of our Bespoke Premium and Institutional research service, clients receive our S&P 500 Quick-View Chart Book, which includes one-year price charts of every stock in the S&P 500. You can literally scan through this report in a matter of minutes or hours, but either way, you will come out ahead knowing which stocks, or groups of stocks, are leading and lagging the market. The report is a great resource for both traders and investors alike. Below, we show the front page of this week’s report which contains price charts of the major averages and ten major sectors.
To see this week’s entire S&P 500 Chart Book, sign up for a 14-day free trial to our Bespoke Premium research service.
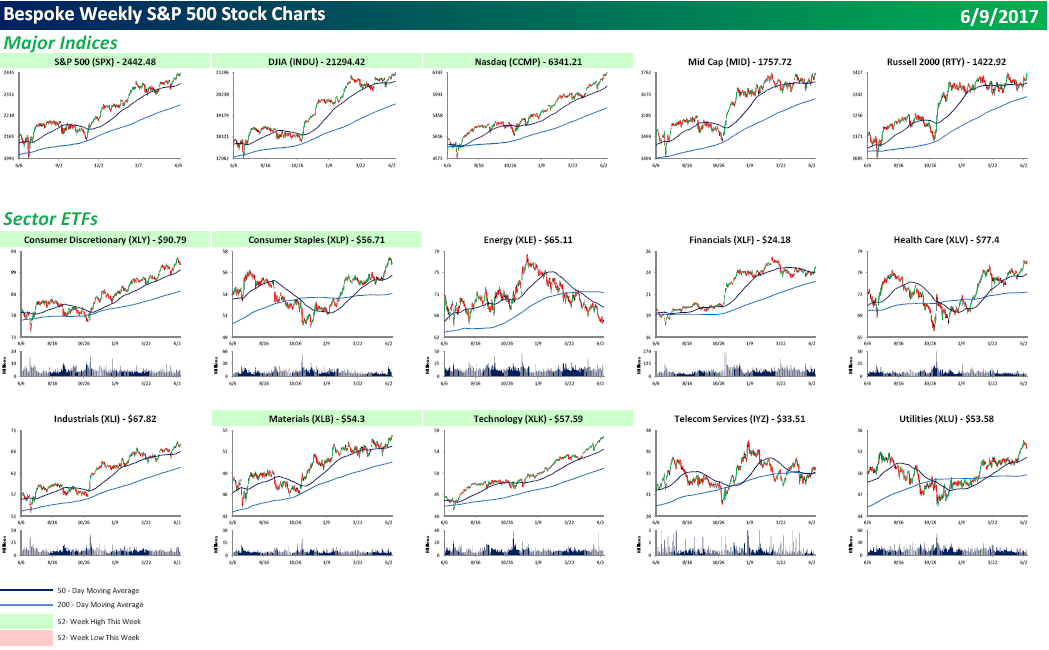
Chart of the Day – Will the Second Half See a Pickup in the Frequency of 1% Days?
B.I.G. Tips – Simultaneous Declines in the Dollar and Crude
Here’s one you don’t see often. While commodities like crude oil and the dollar usually move in the opposite direction, ever since the end of 2016 they have been practically joined at the hip. Year to date, the US Dollar Index has declined by over 5% while crude oil is down more than 15%. Going back to 1983, the current simultaneous decline in both the dollar and oil is one of only 13 times where both have declined more than 5% over a 100-trading day period.
In a B.I.G. Tips report just published, we looked back at prior periods with similar simultaneous declines to see how the dollar, crude oil, and equities in general traded following each period. For anyone interested in seeing the results of this interesting study, sign up for a monthly Bespoke Premium membership now!
The Closer — Debt & Policy: Super Thursday Summarized — 6/8/17
Log-in here if you’re a member with access to the Closer.
Looking for deeper insight on global markets and economics? In tonight’s Closer sent to Bespoke Institutional clients, we recap Super Thursday: early returns from the UK election, a very brief recap of Comey testimony and what it may mean for the market, and the Fed’s quarterly flow of funds report. Today the Bank of Canada released its biannual financial stability report, which we summarize as well. We also introduce a “US policy portfolio” designed to track how the market views the outlook for policy.

The Closer is one of our most popular reports, and you can sign up for a free trial below to see it!
The Closer is one of our most popular reports, and you can see it and everything else Bespoke publishes by starting a no-obligation 14-day free trial to our research!
B.I.G. Tips – The Most Loved and Hated Stocks
ETF Trends: Hedge – 6/8/17
Gold and biotech continue to outperform with Mexico, AUDUSD, and banks also doing well. Oil and gas has lagged performance-wise for quite a while, and is continuing its run of extremely soft performance, while retail, insurance, and a few country ETFs are also well behind in the universe of ETFs we track.

Bespoke provides Bespoke Premium and Bespoke Institutional members with a daily ETF Trends report that highlights proprietary trend and timing scores for more than 200 widely followed ETFs across all asset classes. If you’re an ETF investor, this daily report is perfect. Sign up below to access today’s ETF Trends report.
See Bespoke’s full daily ETF Trends report by starting a no-obligation free trial to our premium research. Click here to sign up with just your name and email address.
Even Financials Are Getting Some Love Today
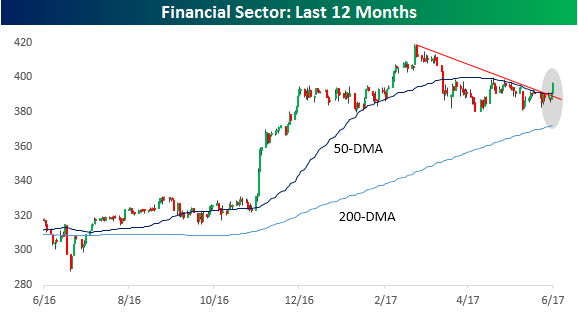
No, there’s no need to go restarting your machine or thinking your phone screen in broken, the Financials really are up over 1% today, and the S&P 500 Financial sector is having its best day since late April. What’s rather encouraging about today’s move for the Financials is that the downtrend that has been in place for the sector since the highs earlier this year appears to have been broken. Now if you’re screen is also showing green next to any Energy sector names, we would advise making an appointment at the genius bar!
In terms of stocks driving today’s move in the Financial sector, some of the biggest winners today have been the biggest losers since the sector peaked on 3/1. The top part of the table below shows stocks in the sector that were down more than 5% between 3/1 and yesterday but are up 3%+ today. The biggest winners are all banks with Regions (RF) and Citizens Financial (CFG) both up over 3.9%. The only major brokerage firm to make the list is Morgan Stanley (MS) which has erased a good portion of it 7.5% decline with a 3.1% gain today. On the downside, just three stocks in the Financial sector are down today and they are all stocks that were up from 3/1 through 6/7. More broadly, of the 17 stocks in the Financial sector that were up from 3/1 through 6/7, the average gain today is just 0.77%. Conversely, of the 48 stocks that were down from 3/1 through 6/7, the average gain today is over 2%.

Bespoke’s Sector Snapshot — 6/8/17
We’ve just released our weekly Sector Snapshot report (see a sample here) for Bespoke Premium and Bespoke Institutional members. Please log-in here to view the report if you’re already a member. If you’re not yet a subscriber and would like to see the report, please start a 14-day trial to Bespoke Premium now.
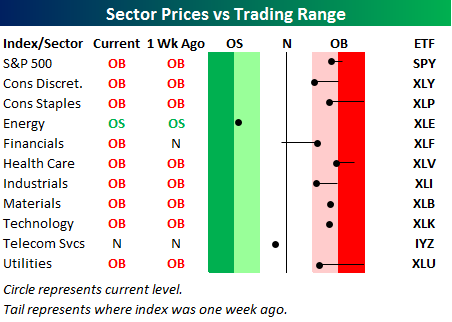
Below is one of the many charts included in this week’s Sector Snapshot, which is our sector trading range screen highlighting where the eleven S&P 500 sectors are currently trading in relation to their 50-day moving averages (black vertical “N” lines). As shown, 9 of 11 sectors are trading above their 50-days, and all 9 of those sectors are currently “overbought.” The Financial sector has had an impressive move higher over the last week.
To see our full Sector Snapshot with additional commentary plus six pages of charts that include analysis of valuations, breadth, technicals, and relative strength, start a 14-day free trial to our Bespoke Premium package now. Here’s a breakdown of the products you’ll receive.