Bespoke Stock Scores: 4/11/17
ETF Trends: International – 4/11/17
WTI has delivered a major rally over the last two weeks, despite a modest decline today. Energy has benefited while the Philippines and Turkey have paced global equity returns over the past week. Retail has also bounced along with bond prices and REITs. Despite the oil rally, Russia has been the worst performing ETF over the past week. South Korea and Brazil have both declined along with steel, base metals, banks, and semiconductors.

Bespoke provides Bespoke Premium and Bespoke Institutional members with a daily ETF Trends report that highlights proprietary trend and timing scores for more than 200 widely followed ETFs across all asset classes. If you’re an ETF investor, this daily report is perfect. Sign up below to access today’s ETF Trends report.
See Bespoke’s full daily ETF Trends report by starting a no-obligation free trial to our premium research. Click here to sign up with just your name and email address.
Bespoke CNBC Appearance (4/10/17)
Bespoke co-founder Paul Hickey appeared on CNBC’s Power Lunch yesterday to discuss markets ahead of earnings season. To view the segment, please click on the image below.
The Closer — Retail Valuation, LMCI Update — 4/10/17
Log-in here if you’re a member with access to the Closer.
Looking for deeper insight on global markets and economics? In tonight’s Closer sent to Bespoke Institutional clients, we take a look at valuation in the retail sector and update our tracking of the Fed’s unofficial labor market conditions index.

The Closer is one of our most popular reports, and you can sign up for a free trial below to see it!
The Closer is one of our most popular reports, and you can see it and everything else Bespoke publishes by starting a no-obligation 14-day free trial to our research!
High Yield Spreads Tracking Equity Prices
Learn more about Bespoke’s research and wealth management services.
Whenever we are looking for positive or negative divergences in the equity market, one area we look to is the high yield credit market. Here, we look to see how spreads on high yield debt relative to treasuries are trending over time. If you are unfamiliar with the term, when we use the term spreads we are simply referring to the difference in yield between a high yield debt security and the yield of a US treasury with a similar maturity. Generally speaking, rising spreads in the high yield market indicate an increase in risk aversion on the part of investors as the higher spread indicates that investors are requiring higher compensation in exchange for taking on the credit risk. Conversely, when spreads are narrowing it indicates that investors are willing to take less in the way of compensation for the particular credit risk.
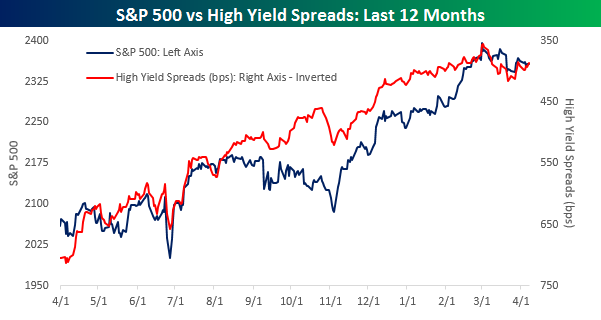
In the chart below, we have plotted the S&P 500 (blue line) versus high yield spreads (red line) based on the Merrill Lynch High Yield Master II Index. However, since spreads tend to move in the opposite direction as prices, we have plotted them on an inverse basis in order to make it easier to compare the two. Looking at the chart, high yield spreads and the equity market have generally tracked each other pretty closely over time. The only period of divergence was a positive one in the summer, where the S&P 500 was drifting lower while spreads continued to narrow. Ultimately, that divergence was a good reason to stay positive even during the uncertainty regarding the election.
Fast-forwarding to the present, high yield spreads have been tracking the S&P 500 pretty closely over the last several weeks. In fact, the S&P 500 saw its most recent peak just as spreads in the high yield market reached their narrowest levels, and since their respective extremes, the S&P 500 has been drifting lower as spreads have been listlessly moving higher. If you’re a bull, in an ideal world you would prefer to see spreads remaining near their narrowest levels or making new lows during this period of consolidation for the S&P 500, but at this point judging by the movement in the high yield market, there is nothing to suggest that the last six weeks of trading have been anything more than a pause.
B.I.G. Tips – Large Cap Coiled Spring
Most Volatile Large Cap Stocks on Earnings
Learn more about Bespoke’s research and wealth management services.
In our prior post we highlighted our quarterly list of the most volatile stocks on earnings. That list contains stocks across the market cap spectrum, and it’s mostly made up of small-cap names. For those that want to see a list of more widely traded names, below is a list of the most volatile stocks on earnings that have market caps greater than $5 billion. As shown, Netflix (NFLX) tops the list with an average one-day move of +/-13.87% in reaction to earnings. Twitter (TWTR) ranks second, followed by Vipshop (VIPS), Priceline (PCLN), Align Tech (ALGN), and Akamai Tech (AKAM).
Amazon.com (AMZN) is another name on the list with an average move of +/-9.61% on its earnings reaction days. With a market cap of more than $425 billion, a 9% move represents a swing of more than $40 billion in market cap once per quarter.
Other notables on the list of most volatile large-cap stocks on earnings include Michael Kors (KORS), Ulta Beauty (ULTA), Nvidia (NVDA), Expedia (EXPE), Chipotle (CMG), Tesla (TSLA), Baidu (BIDU), and Under Armour (UA). Many of you likely own at least one or two of the names on the list below, so be sure to keep a close eye on them heading into their earnings reports this season. Remember, you can always use our Interactive Earnings Report Database to get a sense of how these names typically trade.
To receive Bespoke’s actionable earnings season analysis, sign up for one of our premium membership options today!
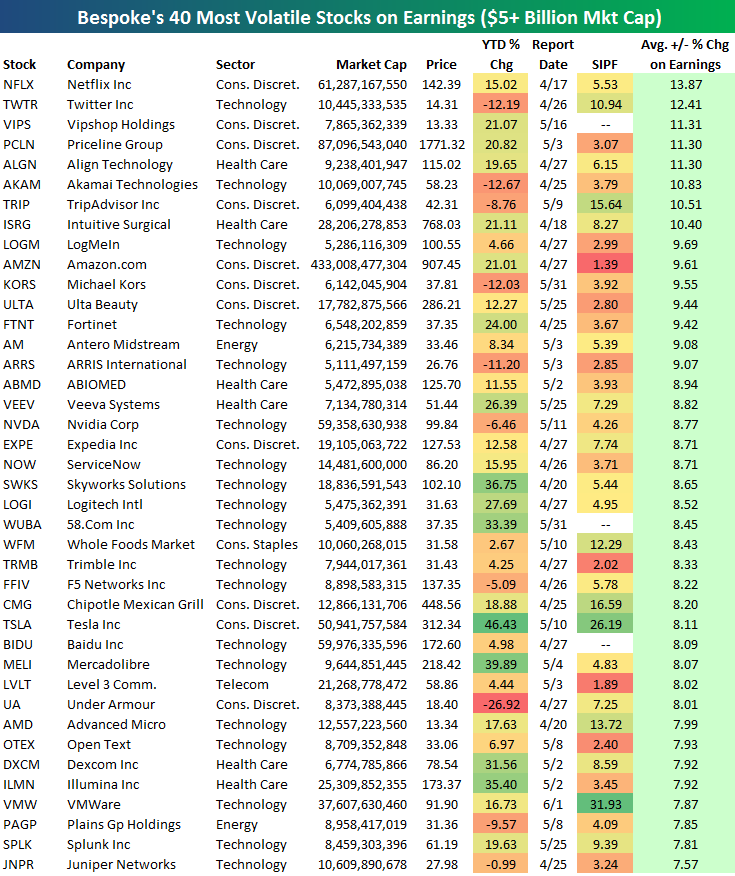
Chart of the Day — The First 100 Days (Of the Year)
Bespoke’s Most Volatile Stocks on Earnings
 Learn more about Bespoke’s research and wealth management services.
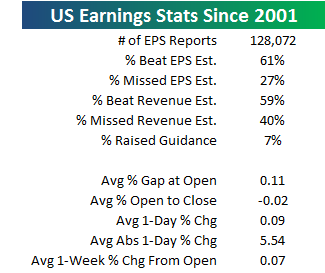
Bespoke has some of the most comprehensive earnings season analysis you’ll find. One of the main products included with our Bespoke Institutional service is our Interactive Earnings Report Database. This database contains more than 128,000 quarterly earnings reports from individual companies going back to 2001. At right we show what percentage of these individual companies have beaten or missed both EPS and revenue estimates (consensus analyst estimates) since 2001. As shown, 61% of earnings reports have been EPS “beats,” while 59% have been revenue “beats.” Just 7% of all quarterly earnings reports have seen the company raise forward guidance.
In terms of share price reaction, the average stock that reports earnings sees an initial gap up of 0.11% on its first trading day following earnings. It then sees an average decline of 0.02% from the open to the close of trading for a full one-day change of +0.09% on its “earnings reaction day.” (For a stock that reports before the open, its earnings reaction day is that trading day. For a stock that reports after the close, its earnings reaction day is the next trading day.)
Finally, in terms of earnings reaction day volatility, the average stock that has reported since 2001 has seen an average absolute 1-day change of +/-5.54%. This means you can expect any given stock to see a move of +/-5.54% on its first trading day following its quarterly earnings report.
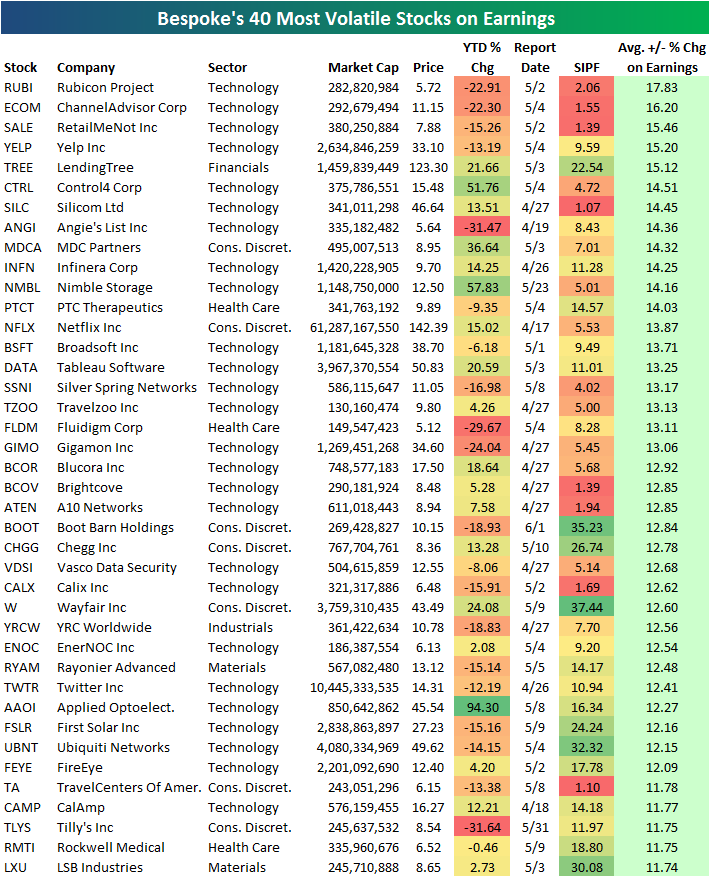
Obviously, some stocks are more volatile than others. Each quarter prior to the start of earnings season, we publish our list of the 40 most volatile stocks on earnings. The stocks that made our list below trade for more than $5/share and have at least 10 quarterly earnings reports in our Interactive Earnings Report Database. As shown, Rubicon Project (RUBI) tops the list with an average move of +/-17.83%! You can expect RUBI to see a one-day move of close to 1/5th of the company’s value when it opens for trading following its report on May 2nd. ChannelAdvisor (ECOM) ranks 2nd with an average move of +/-16.20%, while RetailMeNot (SALE) ranks 3rd at +/-15.46%. Yelp (YELP) and LendingTree (TREE) round out the top five at +/-15%+.
Other notables on the list of most volatile stocks on earnings include Netflix (NFLX), Tableau Software (DATA), Travelzoo (TZOO), WayFair (W), Twitter (TWTR), First Solar (FSLR), and FireEye (FEYE). For each stock on the list, we’ve also included its year-to-date % change and its short interest as a percentage of float (SIPF). You’ll notice that while some stocks are up nicely in 2017, there are plenty that are down quite significantly to start the year as well. Stocks that are down big that also have high levels of short interest are set up to see big upside moves if they can post even remotely positive numbers. Conversely, stocks that are up significantly with low short interest levels could see big downside moves if they don’t knock the cover off the ball.
To receive Bespoke’s actionable earnings season analysis, sign up for one of our premium membership options today!
ETF Trends: US Sectors & Groups – 4/10/17
Oil and energy ETFs continue to outperform along with Philippines equities and broad commodities indices. Decliners over the last five days are broadly found among EM countries, Japanese equities, and European equities.
Bespoke provides Bespoke Premium and Bespoke Institutional members with a daily ETF Trends report that highlights proprietary trend and timing scores for more than 200 widely followed ETFs across all asset classes. If you’re an ETF investor, this daily report is perfect. Sign up below to access today’s ETF Trends report.
See Bespoke’s full daily ETF Trends report by starting a no-obligation free trial to our premium research. Click here to sign up with just your name and email address.