Chart of the Day: Investors Still “Irrationally Exuberant”
B.I.G. Tips – Fed Days June 2017
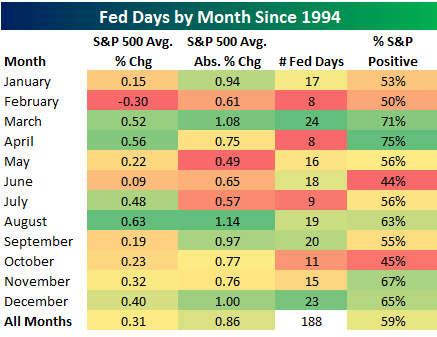
Tomorrow is yet another Fed Day — the third of 2017. Prior to each Fed Day, Bespoke publishes an in-depth analysis of the market’s historical performance on these extremely impactful trading days. You’d be surprised to see just how much of the market’s returns over the years have come from Fed Days, which represent just 3% of all trading days.
As a taste, below is one of many tables and charts included in our Fed Days report. It highlights the S&P 500’s performance on Fed Days by month of the year going back to 1994 when the Fed began announcing policy decisions on the day of its meetings. Unfortunately for market bulls, the S&P 500 has been up on June Fed Days less than any other month of the year. Keep that in mind heading into the trading day tomorrow.
To see our full “Fed Days” analysis, start a 14-day free trial to our Bespoke Premium package now. You’ll receive a 20% off lifetime discount along with the 14-day free trial if you use this checkout link. Here’s a breakdown of the products you’ll receive.
Small Business Confidence Unchanged and Inline
Small Business sentiment from the NFIB was released early this morning and came in unchanged versus April and right inline with expectations at 104.5. After surging as high 105.9 earlier this year, sentiment has drifted lower in the last few months, but still remains well above its historical average levels and not far from the all-time highs seen back in late 2004.

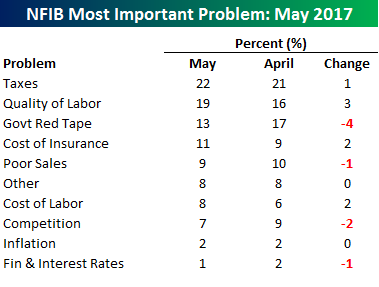
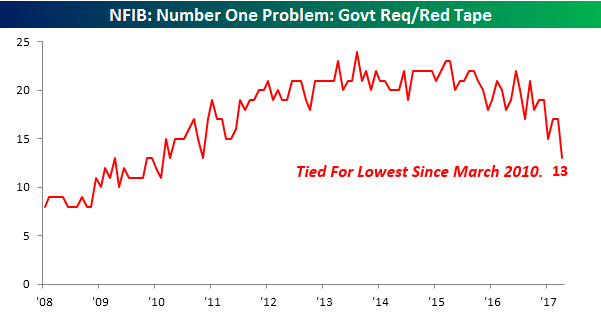
The table below breaks out the different issues that small businesses consider to be their number one problems. Topping the list this month is Taxes, which increased from 21% up to 22%. Not far behind Taxes, more and more small businesses are citing a lack of labor quality as their biggest problem. What’s really notable about this month’s report, though, is the “problem” that isn’t in the number two spot. As shown, Government Red Tape was cited by just 13% of small businesses as their number one problem, which was down from 17% last month. This is only the second time since November 2012 that Taxes and Red Tape haven’t taken up the top two spots. In the case of Red Tape (chart below table), there hasn’t been a month where fewer small businesses cited it as their number one problem in over seven years (March 2010).
The Trump Administration came into office seeking tax cuts and decreased red tape. Thus far nothing has been done on taxes, but the new administration has been able to tackle regulatory issues somewhat. Not coincidentally, the tax issue is still the biggest concern for small businesses, while worries over “government red tape” have dipped quite a bit.
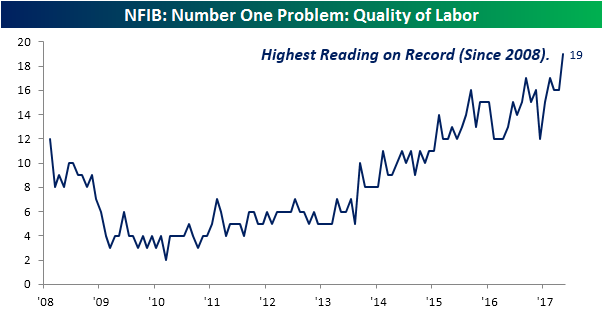
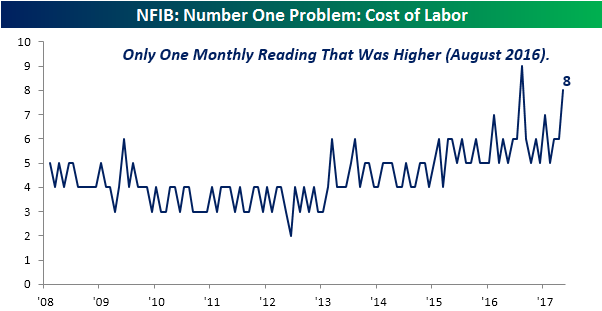
As mentioned above, labor issues are becoming increasingly problematic for small businesses and that could ultimately lead to increased wage pressure. In addition to Quality of Labor, which we mentioned above and show in the chart below, labor costs have also spiked. At this month’s level of 8%, there has only been one other month (August 2016) where more businesses cited labor costs as their number one problem (second chart below).
The Closer — Deficits Close, Canadian Hawks, LatAm Lift — 6/12/17
Log-in here if you’re a member with access to the Closer.
Looking for deeper insight on global markets and economics? In tonight’s Closer sent to Bespoke Institutional clients, we review today’s federal government receipts, expenditures, and deficit data. We also review the outlook for CAD and the BoC after a surprise hawkish speech from a Canadian policymaker today. We also review two solid data points from Latin America released today.

The Closer is one of our most popular reports, and you can sign up for a free trial below to see it!
The Closer is one of our most popular reports, and you can see it and everything else Bespoke publishes by starting a no-obligation 14-day free trial to our research!
ETF Trends: International – 6/12/17
Banks are the best performers over the last five days as the entire sector has broken out; we discussed that development in a blog post earlier today. Worst performers over the last five days include South Africa, large cap tech, semiconductors, and the S&P 500 Tech sector.

Bespoke provides Bespoke Premium and Bespoke Institutional members with a daily ETF Trends report that highlights proprietary trend and timing scores for more than 200 widely followed ETFs across all asset classes. If you’re an ETF investor, this daily report is perfect. Sign up below to access today’s ETF Trends report.
See Bespoke’s full daily ETF Trends report by starting a no-obligation free trial to our premium research. Click here to sign up with just your name and email address.
XLF’s Head & Shoulders Fades In The Rearview Mirror
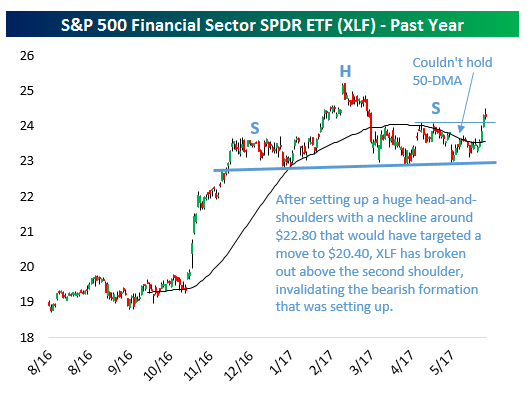
Over the last few months, the S&P 500 Financial sector ETF (XLF) traced out a head-and-shoulders top with shoulders in the high 23s/low 24s with a head above 25. Up until a couple days ago, XLF was also having a very hard time closing above a declining 50 day moving average. Unfortunately for US Bank bears, though, the neckline of the formation held and the set-up never confirmed (which would have been a close in XLF below the neckline. Over the last two days, XLF has carved out steady price action above the level of the right shoulder. That invalidates the technical formation which if confirmed would have targeted a move down to the mid-20s. Of course, just because the head-and-shoulders was never confirmed doesn’t mean XLF is headed higher in a hurry; the neckline is still worth watching as an important support level, although, from a technical perspective, the risk-reward is less biased towards the downside.
Bespoke Stock Seasonality Report – 6/12/17
Chart of the Day – Nasdaq Reversals
Mega-Tech Market Caps Take a Hit
The S&P 500 finished the day slightly lower last Friday, but we saw massive underlying rotation out of large-cap Tech and into other sectors.
Even though the S&P finished in the red on the day, the average stock in the index was up 0.48%. Also, there were 333 advancers on the day versus just 169 decliners.
This is what happens when the largest stocks in a cap-weighted index underperform. All year, it’s been the “mega-Tech” stocks in the S&P that have driven the index higher. But that trade came undone in a big way on Friday.
As shown below, the five largest stocks (AAPL, GOOGL, MSFT, AMZN, FB) in the S&P fell sharply on Friday, and they combined to lose $97.42 billion in market cap. The rest of the stocks in the S&P 500 gained $74.37 billion in market cap.

The chart below shows the change in market cap last Friday by sector. As shown, the overall index lost $23 billion in market cap, but that was nearly all due to losses in Tech. Technology sector stocks lost a combined $142 billion in market cap. The money that came out of Tech shifted right into sectors like Financials, Energy, Health Care, Industrials, Materials, Telecom, and Real Estate. All of these sectors saw inflows, with Financials gaining the most at +$59.8 billion. Energy saw the second biggest gain in market cap at $31.2 billion.

Bespoke Brunch Reads: 6/11/17
Welcome to Bespoke Brunch Reads — a linkfest of the favorite things we read over the past week. The links are mostly market related, but there are some other interesting subjects covered as well. We hope you enjoy the food for thought as a supplement to the research we provide you during the week.
Federal Debt
Twitter investor says US government is bad at managing its finances by Alexandra Scaggs (FTAV)
A brilliant debunking of the deeply problematic attitude that the US government deficit is effectively an income statement. If you read one thing this weekend, make it this. [Link; registration required]
U.S. readying ‘plans and backup plans’ if debt ceiling isn’t raised soon, Mnuchin says by Damian Paletta (WaPo)
A reminder that the debt ceiling will likely be hit by the end of the summer and that the US Treasury is being forced to check for coins under the couch cushions, rather than issue debt for which the markets have ample appetite. [Link]
Trump
The Media Have Been Played by Trump’s Tweets by Bill Murray (Real Clear Politics)
Murray argues that the media is responsible for Trump because they cover his tweets. [Link]
Under Trump, regulation slows to a crawl by Danny Vinik (Politico)
While the lack of new regulations published under the Trump Administration is likely to win cheers from conservatives, it means that the White House is doing very little to alter the course of policy; doing so would require changes to regulations that already exist. [Link]
UK Update
How May’s Sure Thing Became a Political Disaster for the Ages by Tim Ross, Svenja O’Donnell and Alex Morales (Bloomberg)
A brutal tick-tock of the Conservative party reaction to their painful election result Thursday in the UK, which saw their majority in Parliament evaporate in the midst of Brexit negotiations. [Link; auto-playing video]
How Britain Voted by Gregor Aisch, Matthew Bloch, Kenan Davis, Stephen Farrell, Troy Griggs, Rich Harris, and Adam Pearce (NYT)
Less of a read and more of a graphic run-down of the changes in voter preference in the UK this week, with rundowns of the swings in key constituencies, the national swing to Labour, big youth turnout, and a return to dominant position for the two largest parties. [Link]
Britain fears labor shortage as EU workers stay away by Stephen Beard (Marketplace)
With Article 50 triggered and Brexit negotiations underway, the UK’s effort to stem migration via Brexit looks to be creating collateral economic damage already as employers are unable to find workers in several industries. [Link]
All About Amazon
Amazon Introduces Discounted Monthly Prime Offer for Customers Receiving Government Assistance (Amazon)
In an interesting move this week, Amazon has started to segment its Prime customer base by offering consumers receiving government assistance programs (such as SNAP, often referred to as ‘food stamps’) discounted membership. The move speaks to extremely high market penetration among high income consumers and the company’s relentless pursuit to open new markets. [Link]
Some of Amazon’s own brands are becoming super popular online by Jason Del Rey (Recode)
The most popular batteries purchased online, the third-most purchased baby wipe, and a litany of other basic products are all part of Amazon’s private label AmazonBasics. [Link]
Modern Life
Apple is going to let podcast creators — and advertisers — see what listeners actually like by Peter Kafka (Recode)
Up until now, publishers were unable to see how their listeners interacted with podcasts on Apple’s app. Now, that’s changing, creating both opportunity and risk for advertiser-dependent podcasts. [Link]
What are memes — and how do they get kids in trouble? by Elizabeth Weise and Diana Kruzman (USA Today)
A useful background on the evolution of memes, visual in-jokes that communicate ideas quickly and efficiently among digital native young people. [Link]
Your Twitter Outrage May Require Libel Insurance by Polly Mosendz (Bloomberg)
An increasingly popular feature of “umbrella” insurance coverage includes protections against being sued for libel, a risk that had previously only been something journalists were regularly exposed to. [Link]
Long Reads
The Queen Bee of Downtown Durham by Iza Wojciechowska (Bitter Southerner)
Urban beekeeping may seem like a fever dream hatched in the bowels of a Silicon Valley plot line, but the deployment of more than one hundred hives across the Research Triangle Park area by Bee Downtown is a testament to the value of honey pots in cities. [Link]
Take a Look: An Oral History of Reading Rainbow by Jake Rossen (Mental Floss)
A look inside the origins of a fantastic piece of Americana, the PBS program which helped keep kids engaged with books during the summer months. [Link]
The opioid crisis changed how doctors think about pain by Sarah Kliff (Vox)
A deep dive into the sources of the drug epidemic ravaging whole swathes of the country, where pain was swept away with a literal sea of prescription drugs which have now created a huge demand for opioids found in street drugs too. [Link]
He’s heating up, he’s on fire! Klay Thompson and the truth about the hot hand by Tom Haberstroh (ESPN)
An investigation of the folk lore, statistics, and impact of the hot hand in sports, especially professional basketball. [Link]
Musk
Elon Musk: The Man, the Myth, the Risk by Charley Grant (WSJ)
A cogent rundown of the reasoning behind Tesla’s investors, who have completely foregone income statements and balance sheets in pursuit of a far grander vision. [Link; paywall]
Scaffolding
The law that created the billion-dollar scaffold industry has turned city sidewalks into an obstacle course by Aaron Elstein (Crain’s New York)
Ever wonder why New York City sidewalks are so often framed by metal scaffolding? The explanation is a wave of laws designed to prevent building materials from striking pedestrians. [Link]
The Economy
Anxious About the Economy? It’ll Still Set a Record by Tim Duy (Bloomberg)
There’s ample reason to suspect that while the current economic expansion will inevitably end in recession, that kind of pullback in activity is still a long way off. [Link]
Retirement
Retirees flock to Latin America to live an upper-class lifestyle on $1,500 a month by Jim Wyss (The Charlotte Observer/Miami Herald)
The Social Security Administration sends checks to around 380,000 seniors living abroad, up about 50% over the last decade, as US retirees seek lower cost of living in a variety of countries across Latin America. [Link]
Have a great Sunday!