The Closer — One-Offs & Roll-offs — 6/14/17
Log-in here if you’re a member with access to the Closer.
Looking for deeper insight on global markets and economics? In tonight’s Closer sent to Bespoke Institutional clients, we give a full review of the FOMC decision today including how analysis of committee projections, the outlook for policy, and the balance sheet’s role in changes through the rest of the year. We review a very weak CPI print this morning, and summarize weekly petroleum market data from the EIA.

The Closer is one of our most popular reports, and you can sign up for a free trial below to see it!
The Closer is one of our most popular reports, and you can see it and everything else Bespoke publishes by starting a no-obligation 14-day free trial to our research!
ETF Trends: US Indices & Styles – 6/14/17
Banks continue to outperform on a trailing 5 day basis, with KRE and KBE leading the charge. Turkey is the best performing country ETF over the past five days, while homebuilders are also starting to sneak up the performance ranks. Small cap value stocks have also done well, boosted by small cap banks. On the losing side of the slate, only 18 of the more than 200 ETFs we track are down more than 1%, with the worst among them semiconductors, gold miners, and broad tech.

Bespoke provides Bespoke Premium and Bespoke Institutional members with a daily ETF Trends report that highlights proprietary trend and timing scores for more than 200 widely followed ETFs across all asset classes. If you’re an ETF investor, this daily report is perfect. Sign up below to access today’s ETF Trends report.
See Bespoke’s full daily ETF Trends report by starting a no-obligation free trial to our premium research. Click here to sign up with just your name and email address.
Chart of the Day – Yield Curve Flattening Like a Pancake
B.I.G. Tips – Retail Sales Miss Estimates For Second Straight Month
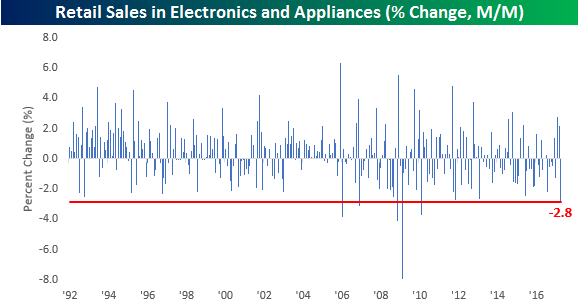
Retail Sales for the month of May were released earlier today and missed expectations for the second straight month. Prior to the last two weaker than expected reports, the two reports before that were right inline with forecasts. Therefore, it has now been over four months since we last saw a stronger than expected retail sales report. In a B.I.G. Tips report just published, we provided our monthly update to the Retail Sales reports, which includes key trends surrounding each month’s release. Just one of the many trends that stuck out this month was that sales in the Electronics and Appliances sector dropped 2.85%. As shown in the chart below, that is the largest monthly decline since March 2010 and the sixth largest m/m decline since data begins in 1992! For anyone interested in seeing this report, sign up for a monthly Bespoke Premium membership now!
Fixed Income Weekly – 6/14/17
Searching for ways to better understand the fixed income space or looking for actionable ideals in this asset class? Bespoke’s Fixed Income Weekly provides an update on rates and credit every Wednesday. We start off with a fresh piece of analysis driven by what’s in the headlines or driving the market in a given week. We then provide charts of how US Treasury futures and rates are trading, before moving on to a summary of recent fixed income ETF performance, short-term interest rates including money market funds, and a trade idea. We summarize changes and recent developments for a variety of yield curves (UST, bund, Eurodollar, US breakeven inflation and Bespoke’s Global Yield Curve) before finishing with a review of recent UST yield curve changes, spread changes for major credit products and international bonds, and 1 year return profiles for a cross section of the fixed income world.
In this week’s note, we take a look at stocks with high dividend yields which offer a margin of safety on dividend coverage and relatively low volatility.
Our Fixed Income Weekly helps investors stay on top of fixed income markets and gain new perspective on the developments in interest rates. You can sign up for a Bespoke research trial below to see this week’s report and everything else Bespoke publishes free for the next two weeks!
Click here to start your no-obligation free Bespoke research trial now!
S&P 1500 Most Heavily Shorted Stocks
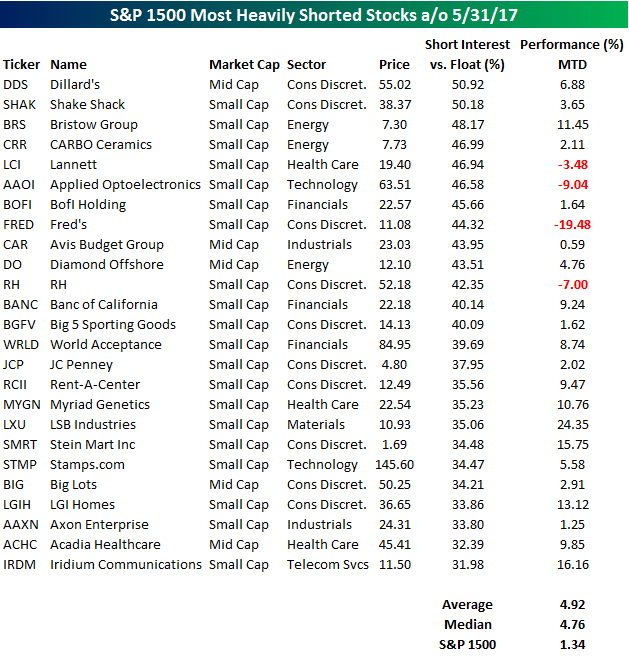
Short interest figures for the end of May were released on Monday after the close, and yesterday we published our semi-monthly look at short interest trends for the S&P 1500 based on market caps, sectors, and groups, as well as stocks with the highest and lowest levels of short interest. We also include an analysis of how the most and least heavily shorted stocks have been performing. The table below contains a summary of the 25 stocks in the S&P 1500 that have the highest levels of short interest as a percentage of float. For each stock, we also include its performance so far in June.
Overall, the 25 stocks highlighted below are up an average of 4.92% (median: 4.76%) so far in June compared to a gain of 1.34% for the S&P 1500. Topping the list of most shorted stocks at the end of May were shares of Dillard’s (DDS) and Shake Shack (SHAK), which each have over half of their free-floating shares sold short. While people can’t get enough of their burgers, investors want nothing to do with Shake Shack stock. Despite the negative sentiment towards both stocks, though, each of them are up so far in June. Finally, as has become a common trend in recent months, many of the most shorted stocks listed like Fred’s (FRED), RH, Big 5 Sporting Goods (BGFV), JC Penney (JCP), Rent-A-Center (RCII), and Big Lots (BIG) are connected to retail as negative bets towards the sector continue to pile up. While the prospects for brick and mortar retail aren’t bright, the trade to bet against them has been getting crowded.
ETF Trends: Fixed Income, Currencies, and Commodities – 6/13/17
Banks continue to outperform and as a consequence Financials, Russell 2000 Value, and S&P 600 Value have also outperformed. Decliners in the past week include precious metals, gold miners, oil, and Brazil. The Nasdaq 100, while one of the worst performers, is down less than 2% over the past week.
Bespoke provides Bespoke Premium and Bespoke Institutional members with a daily ETF Trends report that highlights proprietary trend and timing scores for more than 200 widely followed ETFs across all asset classes. If you’re an ETF investor, this daily report is perfect. Sign up below to access today’s ETF Trends report.
See Bespoke’s full daily ETF Trends report by starting a no-obligation free trial to our premium research. Click here to sign up with just your name and email address.
Bespoke Stock Scores: 6/13/17
The Closer — Brazilian Retail Recovery, US Producer Price Perfidy — 6/13/17
Log-in here if you’re a member with access to the Closer.
Looking for deeper insight on global markets and economics? In tonight’s Closer sent to Bespoke Institutional clients, we chart some more positive Brazilian economic data, review producer price index data from today’s BLS release, and review global ZEW economic current and expected economic indicators.
The Closer is one of our most popular reports, and you can sign up for a free trial below to see it!
The Closer is one of our most popular reports, and you can see it and everything else Bespoke publishes by starting a no-obligation 14-day free trial to our research!