S&P 1500 Most Heavily Shorted Stocks
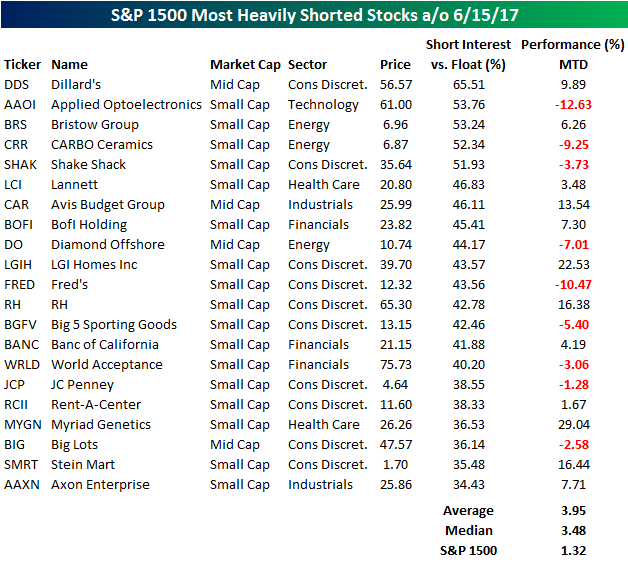
Short interest data for the middle of June was released by the major exchanges on Monday, and below we have highlighted the 21 stocks in the index with more than a third of their float sold short. For each of the stocks listed, we have also included its performance so far in June. While 21 stocks have more than a third of their free floating stocks sold short, five actually have more than half of their float sold short. That’s some pretty negative sentiment!
The title of most heavily shorted stock in the S&P 1500 goes to- wait for it now- surprise, a retailer! Shares of Dillard’s (DDS) not only have half of their float sold short, but nearly two-thirds of its float is currently sold short. You don’t see that very often. Behind DDS, the remaining four stocks in the S&P 1500 with more than half of their float sold short are Applied Optoelectornics (AAOI), Bristow (BRS), CARBO Ceramics (CRR), and Shake Shack (SHAK).
In terms of performance so far this month, the most heavily shorted stocks in the S&P 1500 have done well so far this month averaging a gain of 3.95% (median: 3.48%) compared to a gain of 1.32% for the S&P 1500. The biggest winners have been Myriad Genetics (MYGN) and LGI Homes (LGIH) which are both up over 20%. Not all of the most shorted stocks have been winners, though. Both Applied Optoelectronics (AAOI) and Fred’s (FRED) are both down over 10%.
For anyone who has been tracking our posts on short interest over time will already know, the most heavily shorted stocks have been underperforming the broader market for several months now. The fact that we are now seeing some improvement in terms of relative strength, suggests that investors may be opening up to the idea of moving into riskier stocks.
B.I.G. Tips – July 2017 Seasonality
ETF Trends: Fixed Income, Currencies, and Commodities – 6/28/17
Steel, Natural Gas, and Solar are among those leading the pack this week, all up more than 5%. Retail made a nice recovery and is up about 5% this week after being down 5% last week. Biotech moved in the opposite direction, down about 1% this week. Other notable underperformers are Real Estate, Utilities, and Tech.

Bespoke provides Bespoke Premium and Bespoke Institutional members with a daily ETF Trends report that highlights proprietary trend and timing scores for more than 200 widely followed ETFs across all asset classes. If you’re an ETF investor, this daily report is perfect. Sign up below to access today’s ETF Trends report.
See Bespoke’s full daily ETF Trends report by starting a no-obligation free trial to our premium research. Click here to sign up with just your name and email address.
Chart of the Day: Alphabet’s (GOOGL) EU Blues
Bespoke Global Yield Curve: Flattening Bias
Each Wednesday, Bespoke publishes our Fixed Income Weekly, a seven page recap of what’s happening in the world of rates, credit, and foreign exchange. In addition to novel analysis, a trade idea, charts, and commentary on individual markets, we update subscribers on our Bespoke Global Yield Curve, a GDP-weighted index of the 15 largest economies’ local currency bond yields. Below, we show the current status of the Bespoke Global Yield Curve for each maturity we calculate, as well as the curve’s position as-of three months ago (all values are basis points).
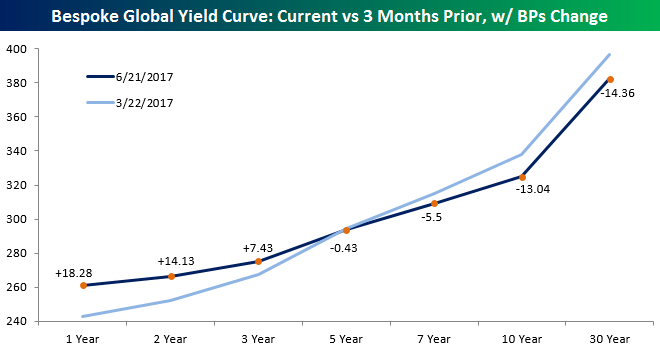
Over the past three months, front-end rates have risen on a GDP-weighted basis for the largest global economies. Mid-curve rates have been basically unchanged, while the long end from 10 years out has seen yields decline.
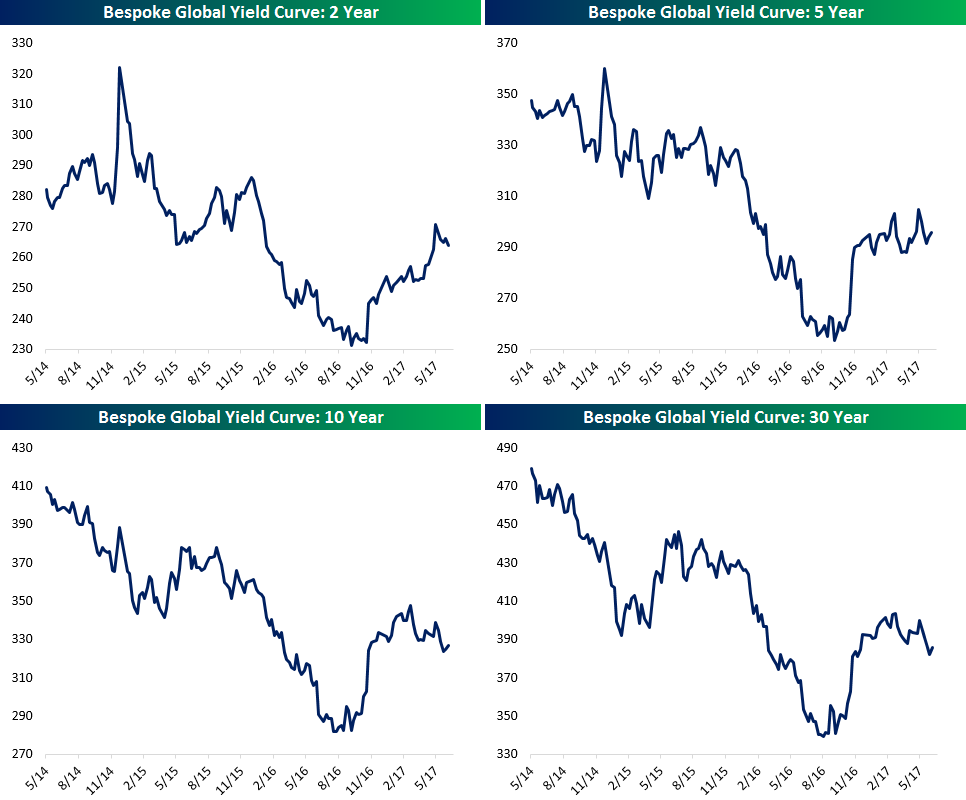
We also chart the current level of key maturities since inception, expressed in basis points. Global yields declined sharply across the curve between late 2014 and mid-2016. Since then, shorter-term yields have trended up (thanks in part to Fed hikes, but also borrowing from tighter monetary conditions in China, a less dovish ECB, and rate hikes in countries like Mexico), and done so fairly consistently. But longer-term yields are well off their highs from the first quarter. Sluggish oil prices tamping down inflation risk, lower term premiums thanks in part to fewer upside surprises in economic data, and less risk-seeking behavior across financial markets are all factors in the outperformance (yields moving inverse to prices) of longer-term securities on a global basis.
Finally, each week we update time series charts of the curvature of our global bond market snapshot. Below we chart the spread between 2 and 10-year yields on the curve (shown in basis points). On a global basis, 2s10s has been flattening quite consistently since mid-2014 when our series starts. Low readings came during growth misses around the world in Q1 2015 and the summer of 2016, with the Brexit vote, recovery in oil prices, and US election serving as temporary steepening catalysts in late 2016 and early 2017. For 5s30s, it’s a broadly similar story, though the curve has flattened less and behaved slightly differently in certain flattening/steepening regimes.
We like the Bespoke Global Yield Curve because it provides a more holistic view of bond markets around the world than a single country’s bond market does. Extreme flattening or steepening in a given country may be driven by idiosyncratic factors that don’t say much about the total global market for fixed income. Changes in the shape and level of the curve are instructive for understanding the current trends in the global economy, as the descriptions above help to illustrate.
Fixed Income Weekly – 6/28/17
Searching for ways to better understand the fixed income space or looking for actionable ideals in this asset class? Bespoke’s Fixed Income Weekly provides an update on rates and credit every Wednesday. We start off with a fresh piece of analysis driven by what’s in the headlines or driving the market in a given week. We then provide charts of how US Treasury futures and rates are trading, before moving on to a summary of recent fixed income ETF performance, short-term interest rates including money market funds, and a trade idea. We summarize changes and recent developments for a variety of yield curves (UST, bund, Eurodollar, US breakeven inflation and Bespoke’s Global Yield Curve) before finishing with a review of recent UST yield curve changes, spread changes for major credit products and international bonds, and 1 year return profiles for a cross section of the fixed income world.
In this week’s note, we discuss global financial conditions and present a trade that is bearish on equities without having to pay carry to be short.

Our Fixed Income Weekly helps investors stay on top of fixed income markets and gain new perspective on the developments in interest rates. You can sign up for a Bespoke research trial below to see this week’s report and everything else Bespoke publishes free for the next two weeks!
Click here to start your no-obligation free Bespoke research trial now!
The Closer — Lat Am Macro, Case-Shtability, Mixed Readings In Richmond — 6/27/17
Log-in here if you’re a member with access to the Closer.
Looking for deeper insight on global markets and economics? In tonight’s Closer sent to Bespoke Institutional clients, we take a look at Latin American macro data released today, highlighting the current situation in Brazil specifically, before reviewing S&P/CoreLogic Case-Shiller Home Price data for April and the Richmond Fed’s June assessment of the district’s manufacturing and services sectors. Finally, we review recent Fed commentary from speeches and interviews given over the past week.
The Closer is one of our most popular reports, and you can sign up for a free trial below to see it!
The Closer is one of our most popular reports, and you can see it and everything else Bespoke publishes by starting a no-obligation 14-day free trial to our research!