ETF Trends: Hedge – 5/2/17
As winter storms have called into question the US grain crop, agricultural commodities have rallied significantly and that’s put DBA (which tracks a basket of agricultural futures) at the top of our best performers list over the last five days. Natural gas, private equity, health care providers, and Vietnam round out the top performers over the last 5 days. Oil, precious metals, and metals and mining were the weakest over the last five days with Canada the weakest country ETF.

Bespoke provides Bespoke Premium and Bespoke Institutional members with a daily ETF Trends report that highlights proprietary trend and timing scores for more than 200 widely followed ETFs across all asset classes. If you’re an ETF investor, this daily report is perfect. Sign up below to access today’s ETF Trends report.
See Bespoke’s full daily ETF Trends report by starting a no-obligation free trial to our premium research. Click here to sign up with just your name and email address.
Ford Truck Sales Roughly Unchanged Y/Y
While we will be updating overall US auto sales on the blog throughout the day, we wanted to provide a quick update on truck sales from Ford. Trucks are not only higher margin, but they are often purchased by small businesses and contractors so they provide a good read on the health of the small business sector. Overall, Ford sales in April disappointed, but truck sales were not quite as negative as the overall sales reading.
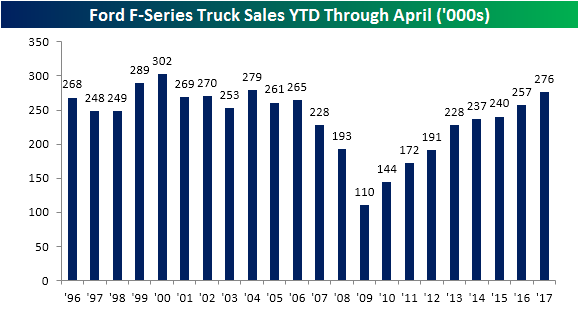
As shown in the first chart below, sales of F-Series trucks were largely unchanged versus April of last year coming in at 70,657 vehicles versus 70,774 in April of 2016. That’s down slightly, but still near the highest levels of the last fifteen years. On a YTD basis, though, overall sales remain strong with total sales of 275,938 trucks compared to 256,895 last year. At that level, total sales in the first four months of the year are the highest since 2004. It also represents a 7.4% increase versus the YTD total last year and is the eighth straight year where sales increased y/y in the first four months of the year. So if truck sales are a decent barometer of the health of small businesses, the first four months of 2017 have been pretty good.

Another Miss In The Pipeline For Auto Sales
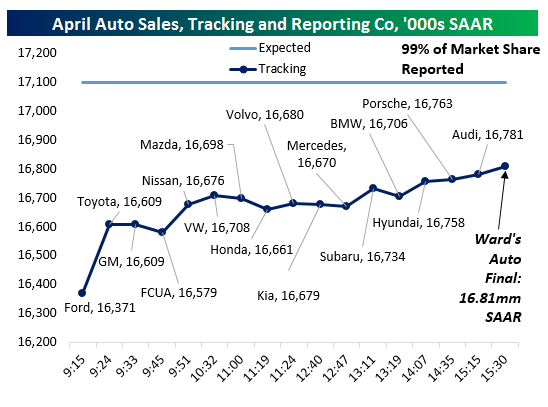
 Update 4 3:42 PM: We now have all 16 major OEMs reported and with that data can be sure that US auto sales missed in April. Full calculations from the Bureau of Economic Analysis won’t be out for another couple of weeks but Ward’s Auto estimated a 16.81mm SAAR sales pace for the month, slightly more optimistic than our 16.78mm SAAR final estimate. AutoData was also more optimistic, tracking 16.88mm SAAR. Regardless, that’s the second month in a row below the 17mm sales pace and a clear miss no matter which estimate you use. With autos coming in weak in April, keep in mind that seasonality in GDP numbers (consumption is typically weaker in Q1 than other months, which we discussed last night in The Closer, link) may not be the only reason for slower consumer spending. Autos and parts consumption subtracted 0.42% off the total QoQ SAAR growth rate in Q1, and the numbers for April don’t suggest a major improvement on that figure for Q2.
Update 3 1:13 PM: A series of smaller OEMs have reported since our last update at and we’ve gotten another series of misses: Honda and Mercedes both saw NSA sales declines of around 7%, while tiny Volvo (only about 1/2 of 1 percent of total US auto market share by units) had a solid report up 15.4% YoY on an unadjusted basis. The overall sales pace is currently tracking about 16.67mm SAAR versus 17.10mm expected, with 84% of the industry reported on a unit volume basis.
Update 2 11:04 AM: Since Nissan’s report, we’ve also gotten reports from Volkswagen and Mazda. As it continues to recover from the diesel emissions scandal, Volkswagen has actually turned in some decent sales growth figures in recent months. It’s got the best sales growth of any auto OEM that’s reported April numbers so far. Mazda on the other hand has been unable to buck the broader industry trend of weaker growth. Following their reports, our tracker sits just below 16.70mm SAAR, suggesting a sales miss of 400,000 units (at an annual pace) in April.
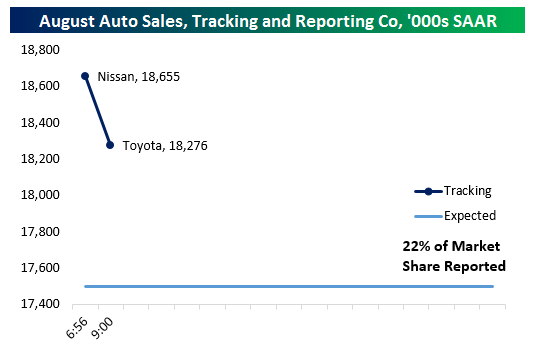
Update 1 9:57 AM: We’ve now gotten reports from Fiat-Chrysler and Nissan to add to the first three major OEMs to report. That brings total reported market share to 68% and suggests an even narrower chance of sales meeting estimates this month despite a more upbeat sales pace from Nissan. We’re currently tracking a sales pace of 16.77mm SAAR versus 17.10mm SAAR expected and will continue to update our tracker as additional estimates come in throughout the day.
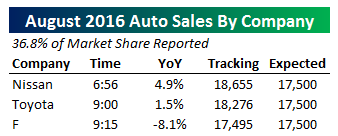
It’s still very early, with only 3 companies reporting, but about 47% of the US auto market’s volume currently in our tracking is suggesting that sales will miss for the month. Economists were estimating a 17.10mm SAAR sales pace for the month, but results from Ford, Toyota, and GM (all of which missed estimates) suggest that there’s a low probability the industry can beat that estimate. GM’s miss was biggest (-5.8% NSA YoY versus -2.0% estimated), but Toyota (-4.4% versus -2.2% estimated) and Ford (-7.1% versus -4.7% estimated) were also pretty weak. We’ll continue to update estimates throughout the day.
B.I.G. Tips — 2017 Decile Analysis
The Closer — Construction And Personal Spending — 5/1/17
Log-in here if you’re a member with access to the Closer.
Looking for deeper insight on global markets and economics? In tonight’s Closer sent to Bespoke Institutional clients, we recap US data today including construction spending and personal income and spending.

The Closer is one of our most popular reports, and you can sign up for a free trial below to see it!
The Closer is one of our most popular reports, and you can see it and everything else Bespoke publishes by starting a no-obligation 14-day free trial to our research!
Chart of the Day: Energy and the Post-Crash Script
April 2017 Headlines
Bespoke Stock Seasonality Report: 5/1/17
ETF Trends: US Indices & Styles – 5/1/17
Biotech has finally dethroned European ETF as champions of trailing performance now that French election gains have rolled out of our five day window. On the losing side of the slate, gold miners and precious metals-related ETFs continue to underperform, as does the Energy space more broadly.
Bespoke provides Bespoke Premium and Bespoke Institutional members with a daily ETF Trends report that highlights proprietary trend and timing scores for more than 200 widely followed ETFs across all asset classes. If you’re an ETF investor, this daily report is perfect. Sign up below to access today’s ETF Trends report.
See Bespoke’s full daily ETF Trends report by starting a no-obligation free trial to our premium research. Click here to sign up with just your name and email address.
ISM Manufacturing Miss
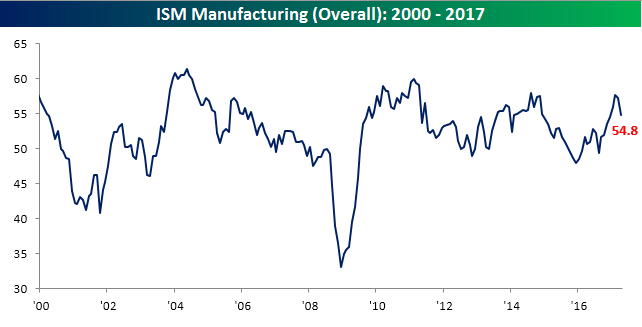
Economic data to kick off the month hasn’t exactly been positive as the April read on ISM Manufacturing came in weaker than expected, falling to its lowest level of the year. While economists were forecasting the headline reading to come in at a level of 56.5, the actual reading fell to 54.8, making it the biggest miss relative to expectations since last September’s report for the month of August.
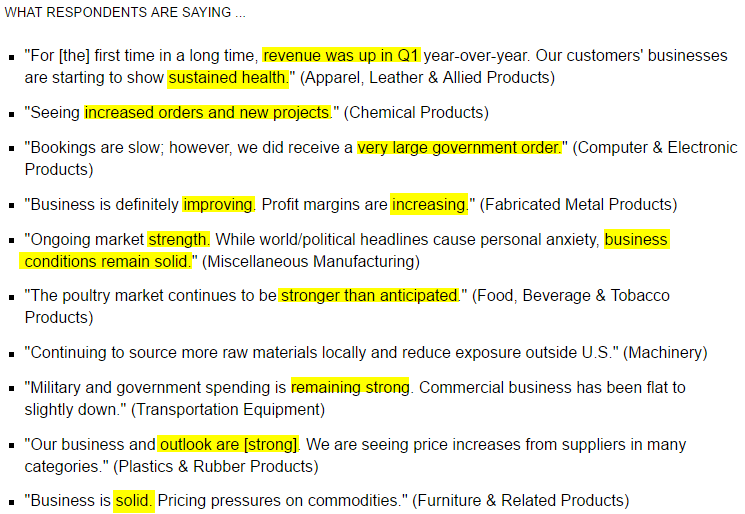
While the headline number of the April report was weaker than expected, the overall tone of comments from respondents was positive according to ISM. Below we provide a sampling of commentary from respondents included in the report. Despite the fact that the report was weaker than expected, overall conditions in the manufacturing sector appear solid.
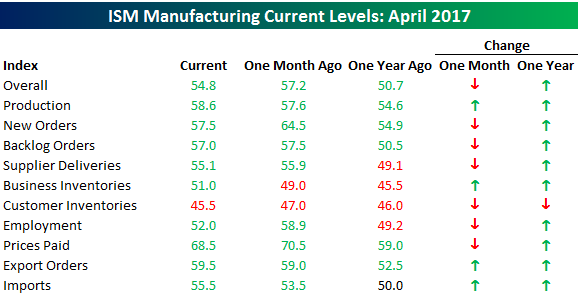
The table below breaks down this month’s report by each of its individual components. Overall breadth in the report was skewed slightly negative on a month/month basis, but relative to where things stood last year at this time, conditions are much improved.
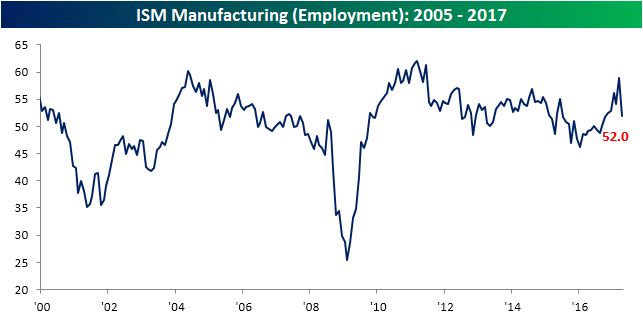
Finally, below we wanted to highlight a couple of notable charts from this month’s report. First, on the employment front, that component saw its largest monthly drop this month since November 2008. That doesn’t bode especially well for the employment report this Friday, but given the sector’s small size relative to the overall economy, it is not a major negative. If we see this type of weakness in the employment component of the ISM Services report later this week, we’ll be a lot more concerned.
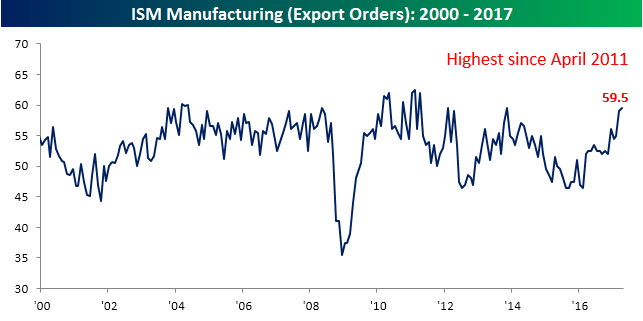
Finally, we’ve been talking a lot lately about how we expect strength in international markets to outpace the US going forward, and part of this can be seen in the measurement of export orders. In this month’s report, that component increased to 59.5, which is the highest in six years. When it comes to US vs ROW (Rest of World), ROW appears to be taking the lead.