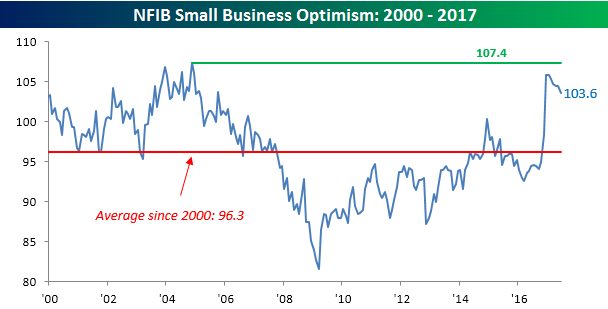
Small Business Optimism Weaker Than Expected
Small Business Optimism from the NFIB came in weaker than expected for the month of June, falling from 104.5 down to 103.6. Economists had been forecasting a level of 104.4. To illustrate just how strong this index has been of late, the 0.9 point downside move in June represents the largest m/m decline since February 2016! Following June’s decline, the recent moves in the NFIB can be looked at from two different perspectives. On the optimistic side, the index is still well above its historical average of 96.3 going back to 2000. From the pessimistic side, however, the index has clearly lost momentum following the post-election surge, and in the process, it fell short of reaching its highs from the prior expansion. The jury is still out on which side will prove to be correct.
Click here to start a no-obligation two-week free trial to our premium research platform.
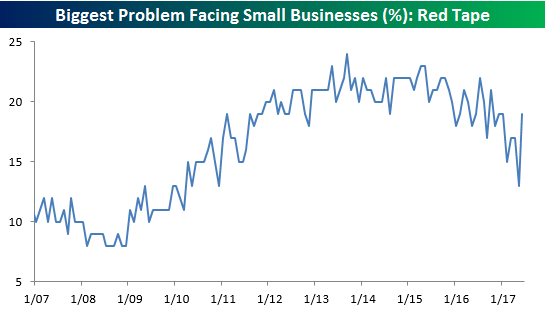
In terms of what issues small business owners consider to be their biggest problems, this month we saw some interesting moves. The biggest of these was in Government Red Tape, which was cited by 19% of small business owners and up from 13% in May. On a m/m basis, no other ‘problem’ saw an increase of more than 1 percentage point. On the downside, respondents who were worried about the Quality of Labor and Cost of Insurance seem less worried now and instead are more focused on red tape.

This month’s increase in the percentage of respondents citing Government Red Tape as their number one problem is noteworthy due to the fact that it is the largest m/m increase on record. Obviously, delays in Washington on reforming health care and reigning in regulations is weighing on sentiment. Prior to this month, the two largest m/m increases in the “problem” of red tape were in January 2009 (Obama Inauguration) and April 2010 (the month after the Affordable Care Act was signed into law). Amazingly, even after this month’s increase, the percentage of small business owners citing Government Red Tape as their number one problem is below where it was last October before the election.
Click here to start a no-obligation two-week free trial to our premium research platform.
The Closer — Dollar Rates, Consumer Credit, European Population — 7/10/17
Log-in here if you’re a member with access to the Closer.
Looking for deeper insight on global markets and economics? In tonight’s Closer sent to Bespoke Institutional clients, we discuss the valuation of the US dollar, consumer credit growth reported this afternoon, and Eurostat’s new estimates for the European Union’s population.

The Closer is one of our most popular reports, and you can sign up for a free trial below to see it!
The Closer is one of our most popular reports, and you can see it and everything else Bespoke publishes by starting a no-obligation 14-day free trial to our research!
Most Volatile Stocks on Earnings
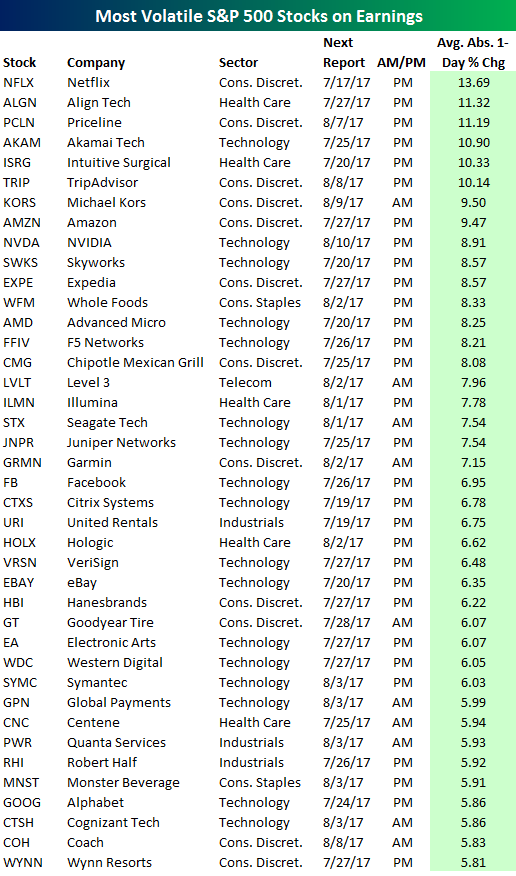
At the start of each earnings season, we provide an updated list of the most volatile stocks on earnings. Using our Interactive Earnings Database, below is a list of the S&P 500 stocks set to report earnings over the next month that have historically had the biggest price swings on their earnings reaction days. (For stocks that report before the open, their earnings reaction day is that trading day. For stocks that report after the close, their earnings reaction day is the next trading day.)
As shown, Netflix (NFLX) is the most volatile S&P 500 stock on earnings with an average move of +/-13.69% on its earnings reaction day. Align Tech (ALGN) ranks second at +/-11.32%, followed by Priceline (PCLN) in third at +/-11.19%. Akamai (AKAM), Intuitive Surgical (ISRG), and TripAdvisor (TRIP) are the only other stocks in the S&P that average one-day swings of more than 10% on their earnings reaction days.
Other stocks in the S&P 500 that experience huge moves in reaction to earnings include names you might expect like Amazon (AMZN), NVIDIA (NVDA), AMD, Chipotle (CMG), Facebook (FB), Alphabet (GOOG), and Wynn Resorts (WYNN). What is somewhat of a surprise, though, is that many of these stocks are now among the largest in the world. For such large stocks to see large swings like that is uncommon relative to history.
Next to each stock we also include when it’s expected to report this season, so keep an eye out if you own or follow any of these volatile large-cap names.
The table above highlights the most volatile S&P 500 stocks set to report earnings over the next month. Below is a list that looks at all stocks traded on US exchanges. The 40 stocks below must have at least 12 earnings reports (3 years worth of earnings) on file. As shown, Groupon (GRPN) is the single most volatile stock on earnings in the US that’s set to report over the next month. When it reports earnings, it typically moves up or down roughly 18% on its earnings reaction day. That’s a big move considering that it happens once every 3 months!
Rubicon Project (RUBI) is the second most volatile stock on earnings at +/-16.51%, followed by ServiceSource Intl (SREV), YELP, ChannelAdvisor (ECOM), and Rocket Fuel (FUEL). Other notables on the list include LendingTree (TREE), Netflix (NFLX), Tableau Software (DATA), First Solar (FSLR), FireEye (FEYE), and Twitter (TWTR).
Click here to start a no-obligation two-week free trial to our premium research service which includes more in-depth earnings season analysis.

Bespoke Stock Seasonality: 7/10/17
Chart of the Day: Breadth Hanging In
Sectors Also Picking Up in Second Half Where They Left Off The First
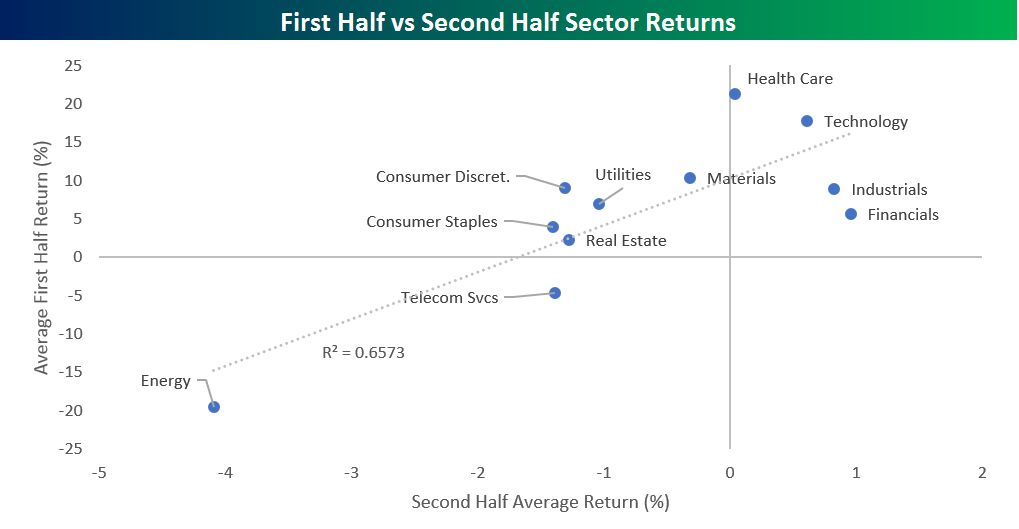
In an earlier post, we highlighted the fact that some of the biggest winners in terms of individual stocks in the second half so far were also up strongly in the first half. Similarly, the worst performers to start the second half were also down big in the first half. In terms of sector performance, the continuation pattern is even more apparent.
The scatter chart below compares the average return of stocks in the Russell 1000 by sector in the first half (y-axis) to their average return in the second half through last Friday (x-axis). Here, there is a clear pattern where the sectors with the stocks that did best in the first half are continuing to feel the love in the second half, while the sectors with the worst average performance in the first half continue to be out of favor in the second half. For example, stocks in the Energy sector were down the most in the first half, and they are off to the weakest start in the second half as well. Similarly, the sectors with the best-performing stocks in the second half were all positive in the first half as well. As shown, the trendline of returns for all eleven sectors has an r-squared of 0.65, which implies a strong positive correlation. Obviously, a lot can change as time goes on, but so far this half investors are using a very similar playbook in the second half as they did in the first.
Click here to start a no-obligation two-week free trial to our premium research platform.
ETF Trends: Hedge – 7/10/17
A lot of new names appear on our list of best performing ETFs this week. Among these, India, Coffee, and Italy are the most notable ETFs making solid gains. Financials and Banks also sustained their momentum from previous weeks. Those continuing movement in the negative direction are Oil and various commodities, which has been a trend as of late. Retail and Energy are other notables in the red, both down nearly 4%.

Bespoke provides Bespoke Premium and Bespoke Institutional members with a daily ETF Trends report that highlights proprietary trend and timing scores for more than 200 widely followed ETFs across all asset classes. If you’re an ETF investor, this daily report is perfect. Sign up below to access today’s ETF Trends report.
See Bespoke’s full daily ETF Trends report by starting a no-obligation free trial to our premium research. Click here to sign up with just your name and email address.
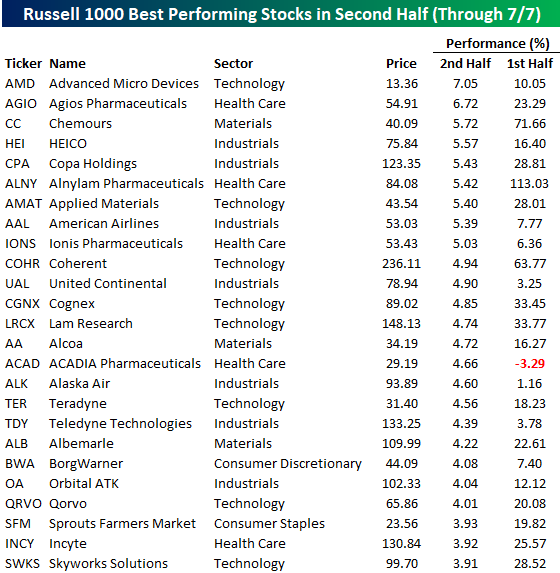
Second Half Picking Up Right Where First Half Left Off
The second half of the year is only three and a half trading days old, but there have already been some decent winners and big losers among large cap stocks in the Russell 1000. The first table below lists the 25 best-performing stocks in the Russell 1000 through the first week of the second half. Leading the way higher, shares of Advanced Micro (AMD) are already up 7%, nearly matching their first-half gain of just over 10%. Behind AMD, Agios Pharma (AGIO) is up 6.7%, followed by Chemours (CC) and HEICO (HEI) rounding out the top four. Airlines have gotten off to a strong start in July so far as four made the list of best performers (Copa, American, United Continental, Alaska Air) with gains of more than 4.5%. Other notables listed include Alcoa (AA), Albermarle (ALB), and Skyworks Solutions (SWKS).
One trend that stands out among the biggest winners so far in the second half is that they also did very well in the first half too. Of the 25 names listed, just one (ACADIA Pharma) was down in the first half, and the average first-half gain was over 24%!
Click here to start a no-obligation two-week free trial to our premium research platform.
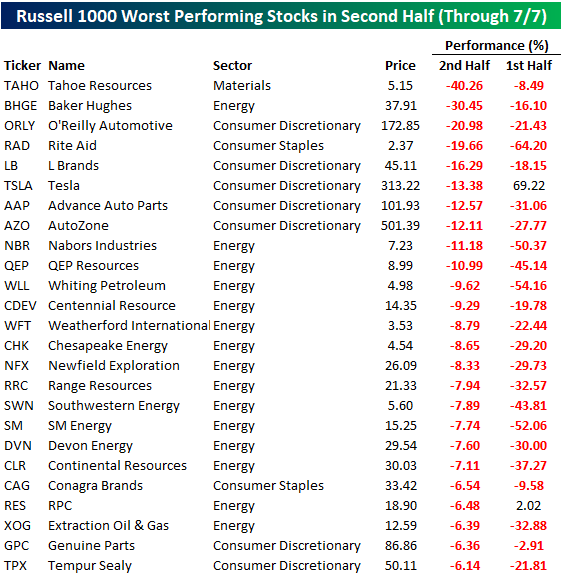
While just nine stocks in the Russell 1000 are up over 5% in July, a number of stocks are already down big, and we mean really big! The table below lists the 25 biggest losers in the Russell 1000 so far in the second half. As shown, three stocks are already down over 20%, while another seven stocks are down over 10%! Leading the way to the downside, Tahoe Resources (TAHO) is down over 40% after falling over 8% in the first half. Things have been even worse for Rite Aid (RAD), whose performance has been anything but “rad.” After losing nearly two-thirds of its value in the first half, the stock is already down nearly 20% in July! The real pain point so far in the Russell 1000 is the Energy sector. The average stock in the sector is already down over 4%, and less than one out of every ten stocks in the sector are up.
Like the list of winners, there is clearly a trend in the losers as well. As shown, just two of the biggest losers in the second half were up in the first half. The big standout here is Tesla (TSLA). After rallying 69% in the first half, the stock has been the sixth biggest loser in the second half falling more than 13%. Even including TSLA’s big first half gain, the average decline of the 25 biggest losers in the first half was a haircut of 25%! So far at least, the second half of 2017 is picking up right where the first half left off.
Click here to start a no-obligation two-week free trial to our premium research platform.
The Closer: End of Week Charts — 7/7/17
Looking for deeper insight on global markets and economics? In tonight’s Closer sent to Bespoke clients, we recap weekly price action in major asset classes, update economic surprise index data for major economies, chart the weekly Commitment of Traders report from the CFTC, and provide our normal nightly update on ETF performance, volume and price movers, and the Bespoke Market Timing Model. This week, we’ve added a section that helps break down momentum in developed market foreign exchange crosses.
The Closer is one of our most popular reports, and you can sign up for a free trial below to see it!
Click here to start your no-obligation two-week free Bespoke research trial now!
Bespoke Brunch Reads: 7/9/17
Welcome to Bespoke Brunch Reads — a linkfest of the favorite things we read over the past week. The links are mostly market related, but there are some other interesting subjects covered as well. We hope you enjoy the food for thought as a supplement to the research we provide you during the week.
See this week’s just-published Bespoke Report newsletter by starting a no-obligation two-week free trial to our premium research platform.
Economic Measurement
On the measuring and mis-measuring of Chinese growth by Hunter Clark, Maxim Pinkovskiy, Xavier Sala-i-Martin (Voxeu)
An effort to gauge Chinese GDP growth based on the amount of light thrown off by cities and towns at night, suggesting that recent activity has been stronger than reported, rather than weaker. [Link]
Goldman Sachs thinks the opioid crisis is so bad it’s affecting the economy by Evelyn Cheng (CNBC)
Spiraling use and abuse of opiods for pain management has created a crisis, with more than 90 Americans killed by overdoses each day. Goldman thinks that is holding down the labor force participation rate. [Link, auto-playing video]
Big Thoughts From Tech
Bill Gates Made These 15 Predictions In 1999 – And It’s Scary How Accurate He Was by Biz Carson (Business Insider)
Payments, shopping, mobile devices, social media…all predicted years before they were deployed. [Link]
The music industry according to super-producer Jimmy Iovine by Matthew Garrahan (FT)
Inside the head of the billionaire founder of Beats, who now directs Apple’s strategy around music. [Link, soft paywall]
Investing
Tech Stocks Boom, but Some Stock Pickers Are Wary by Landon Thomas Jr (NYT)
It’s almost impossible to outperform when you’re not at least equal-weight the huge tech giants which have surged to new all-time highs this year. [Link, soft paywall]
A Kansas Investment Firm Spurring Change on Wall Street by Landon Thomas Jr (NYT)
A look at the RIA industry and the new approach it brings to helping Americans manage their assets, including a greater focus on services over products. [Link, soft paywall]
User Error
Finance sites erroneously show Amazon, Apple, other stocks crashing by Mike Murphy (Marketwatch)
Test data from Nasdaq was released into the public stock pricing feeds that power numerous data providers, causing a night of chaos this week. [Link]
Shkreli’s Hedge Fund Went From Success to Bust in 31 Minutes by Patricia Hurtado and Misyrlena Egkolfopoulou (Bloomberg)
One investor received two emails a half hour apart showing gains of $135,000 and complete losses after an investment with Martin Shkreli. [Link]
Food
So Long, Hamburger Helper: America’s Venerable Food Brands Are Struggling by Annie Gasparro and Saabira Chaudhuri (WSJ)
Shifting consumer preferences, ineffective marketing strategies, and the falling market share facing big food brands in the grocery aisle. [Link, paywall]
Durability
Roman concrete is still standing tall – and now we know why by James Temperton (Wired)
By infusing their staple building material with seawater, Roman architects were able to make it last two millennia and counting. [Link]
Sports
Dak Prescott accused of using machine to sign autograph by Darren Rovell (ESPN)
The Dallas Cowboys quarterback has been accused of using a performance enhancing machine to sign cards tirelessly without holding a pen. [Link]
Science
Is the staggeringly profitable business of scientific publishing bad for science? by Stephen Buranyi (The Guardian)
A deep dive into the world of for-profit scientific journals and the consequences of perverse incentives for that business model as it interfaces with the world of scientific discovery. [Link]
European Banks
Rough policy notes on Veneto Banca and Banca Popolare di Vicenza (V&V) by Jonathan Alger (Medium)
A comprehensive and in-the-weeds look at recent ECB actions to resolve two failing periphery banks. Filled with jargon and impressive detail that probably goes well over the head of the casual reader but a very helpful resource on the complex subject of the ECB’s governance of banks. [Link]
Code
A programmer figured out how to automate his job and work 2 hours a week — but he’s not sure it’s ethical by Julie Bort (Yahoo! Finance/Business Insider)
Maybe slow productivity is being caused by worker deception? We kid, but the ethical dilemma involved with this worker’s efforts to become more efficient is definitely interesting. [Link]
Have a great Sunday!