ETF Trends: Hedge – 5/9/17
South Korean equities have surged as that country’s Presidential election to replace the impeached Park Geun-hye resulted in a victory for center-left candidate Moon Jae-in per exit polls and early vote counts. European equities, Japanese stocks with FX hedges, and retail are some of the other strong performers. The lack of turnover in the worst performers is notable with commodity plays continuing to underperform including steel companies, miners, gold, and oil equities. Australia is the worst performing country ETF we track over the last week.

Bespoke provides Bespoke Premium and Bespoke Institutional members with a daily ETF Trends report that highlights proprietary trend and timing scores for more than 200 widely followed ETFs across all asset classes. If you’re an ETF investor, this daily report is perfect. Sign up below to access today’s ETF Trends report.
See Bespoke’s full daily ETF Trends report by starting a no-obligation free trial to our premium research. Click here to sign up with just your name and email address.
Bespoke Stock Scores: 5/9/17
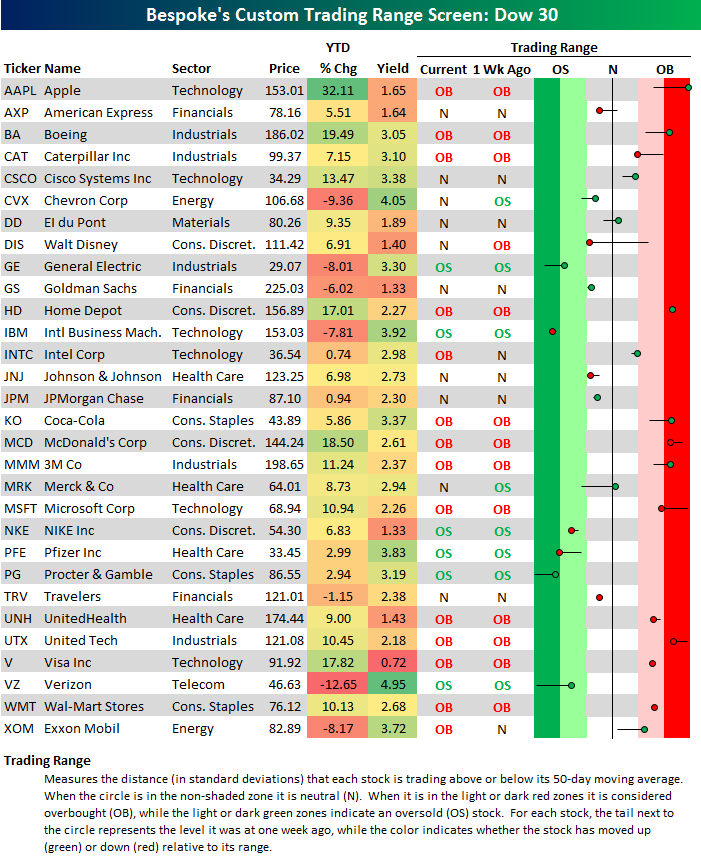
Bespoke’s Dow 30 Trading Range Screen
Below is an updated look at our Dow 30 trading range screen. For each stock, the black vertical “N” line is its 50-day moving average, while moves into the red or green zone are considered overbought or oversold. A stock is considered “overbought” when it’s more than one standard deviation above its 50-day moving average, and vice versa for oversold. The dark red and green shaded areas represent between two and three standard deviations above (or below) the 50-DMA.
As shown in the screen, Apple (AAPL) is currently the most overbought stock in the Dow — trading at nearly 3 standard deviations above its 50-day. With a gain of 32% YTD, Apple is having a monster year. Other overbought stocks in the index include Boeing (BA), Home Depot (HD), 3M (MMM), McDonald’s (MCD), and United Tech (UTX).
Dow stocks on the oversold side include General Electric (GE), IBM, Nike (NKE), Pfizer (PFE), Procter & Gamble (PG), and Verizon (VZ). Verizon (VZ) is currently the worst performing Dow stock year-to-date with a decline of 12.65%.
If you’re not yet a Bespoke Premium member, start a 14-day free trial to gain access to our most actionable content and model stock portfolios.
Bespoke’s Interactive Earnings Calendar Demo
Bespoke’s Interactive Earnings Report Calendar lets investors and traders easily find earnings report dates and times for companies set to report quarterly numbers in the weeks and months ahead. As investors ourselves, we used to constantly have to track down earnings report dates from a number of different websites, so we created our own online calendar to make the process much easier. Below are a series of screenshots that show you how to find and use Bespoke’s Earnings Report Calendar.
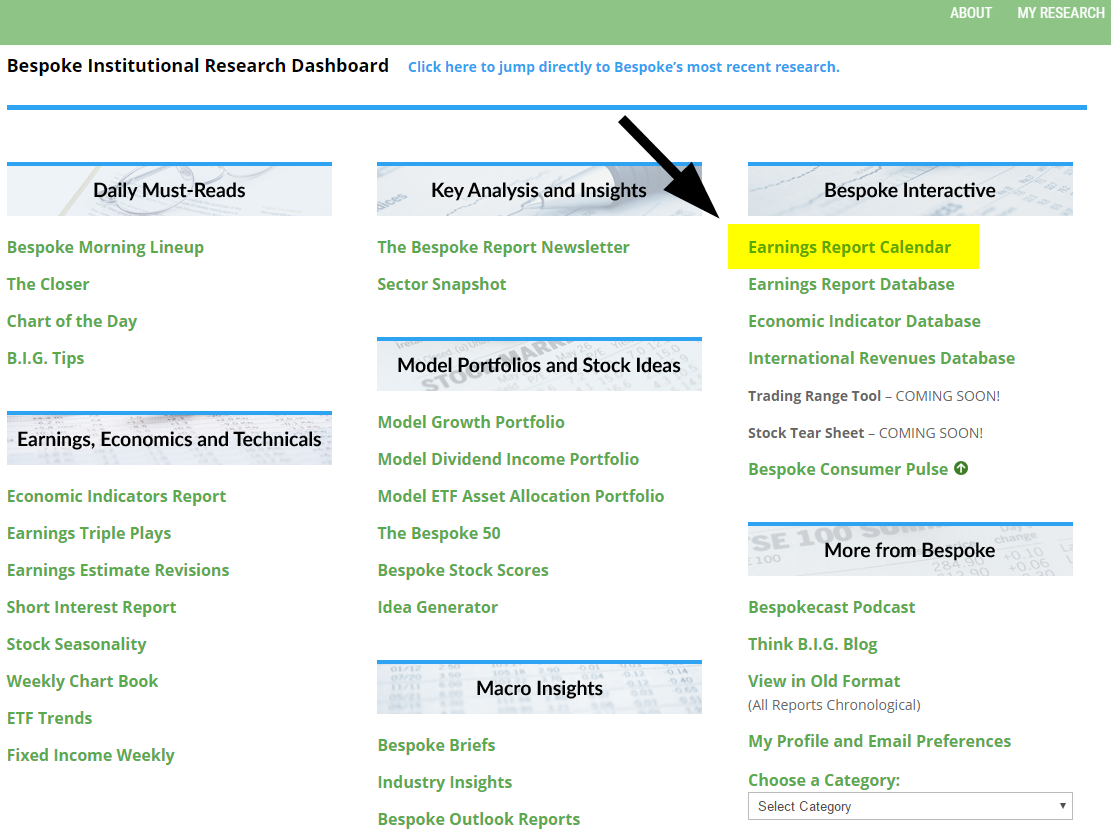
First, if you’re not yet a Bespoke Premium subscriber, start a 14-day free trial to gain access to the calendar. From the “My Research” dashboard upon logging in, click on “Earnings Report Calendar” under the “Bespoke Interactive” section in the right-most column.
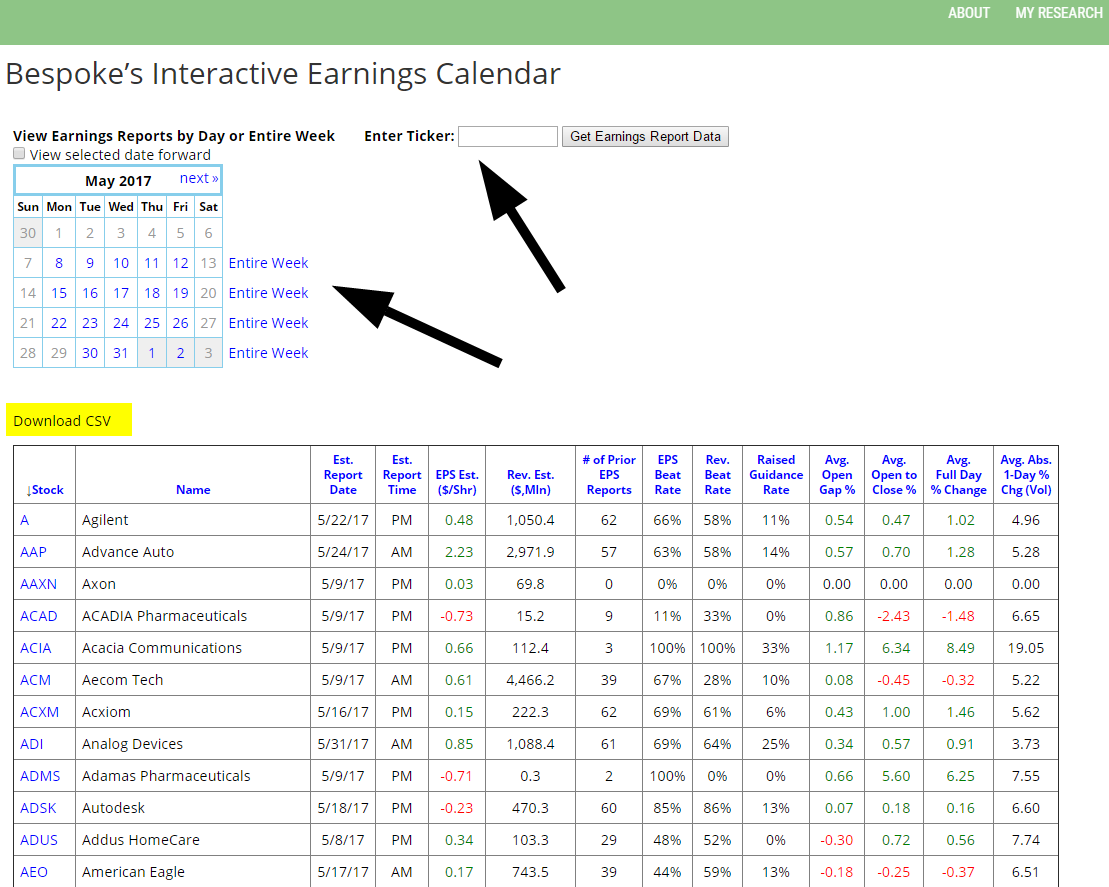
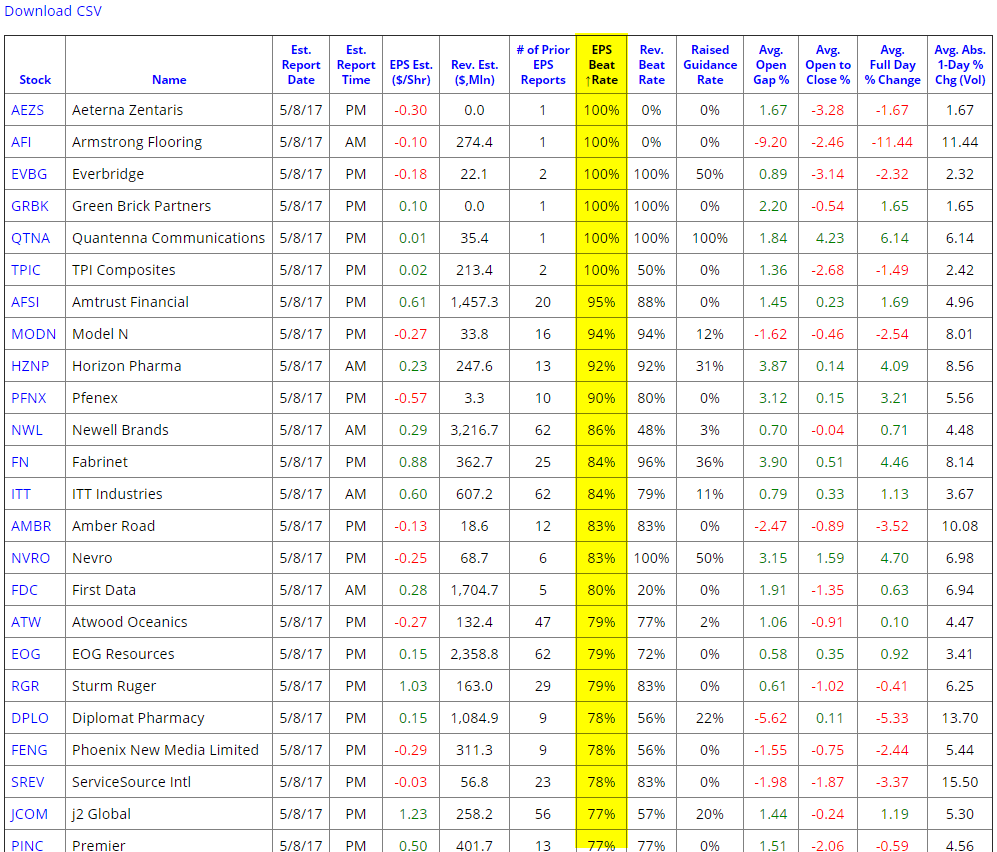
Once the Interactive Earnings Report Calendar page is loaded, you can seek out earnings report information in a number of ways. As shown below, you can enter a specific stock ticker and click on “Get Earnings Report Data,” use the monthly calendar section (top left of page) to click on a specific date or week, download the entire calendar into Excel with a CSV file, or just scroll through the entire list of stocks set to report earnings in the coming weeks (bottom of page).
In the example below, we’ve entered the stock ticker “AFAM” and pulled up its expected report date and time, which is 5/8/17 in the AM (AM means pre-open). Entering a stock ticker also pulls up historical quarterly earnings report information like the % of time the stock has beaten earnings and revenue estimates, the average price change that the stock experiences in reaction to earnings beats and misses, and how volatile the stock typically is on its earnings reaction day.
We’ve also clicked on the 8th of May in the calendar section in the example below, which then populates all companies set to report earnings on 5/8/17.
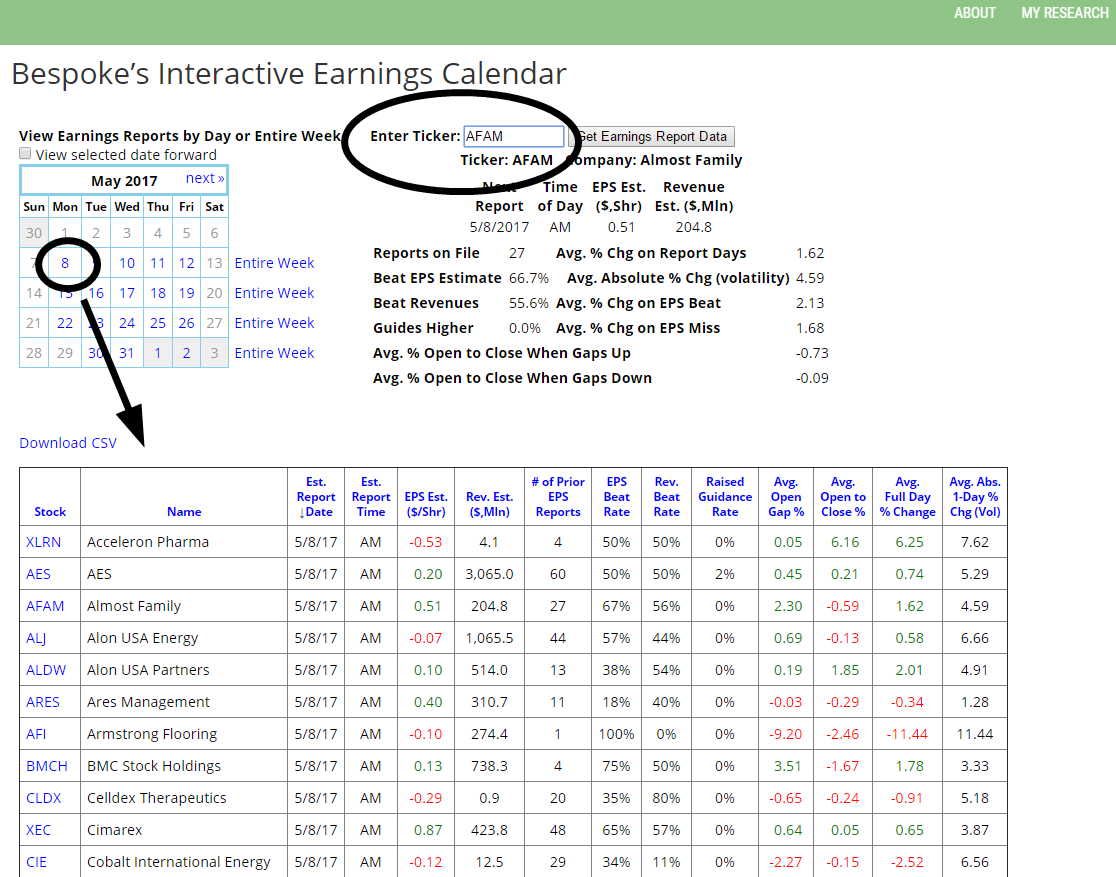
In the table section of Bespoke’s Earnings Report Calendar, you can click on the column headers to sort the data. This helps you identify stocks set to report earnings that have the highest (or lowest) earnings beat rates, the highest (or lowest) revenue beat rates, the stocks that raise guidance the most, and the stocks that typically react the most positively or negatively to their earnings reports.
There are an endless number of ways to use the calendar. The simplest is to use it to find the expected earnings report date for a stock you’re following. Go ahead and bookmark Bespoke’s Earnings Report Calendar if you’re already a Bespoke Premium or Bespoke Institutional member. If you’re not yet a member, start a 14-day free trial to Bespoke Premium to gain access to the calendar.
NFIB Drops For Third Straight Month
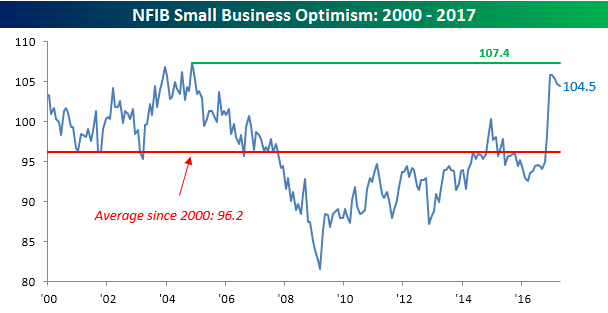
NFIB Small Business Optimism was released earlier this morning and showed a m/m decline for the third straight month. While a trend like that would sure seem to indicate that the post-election optimism has worn off, at a level of 104.5, the headline index is still nearly ten points higher than it was last October. On top of that, April’s reading of 104.5 also came in better than expected. It’s also interesting to note that the last time this index saw a three month losing streak was in the beginning of 2016, and in the first three months of 2015 it also saw two large declines in the first quarter as well, so there may be some seasonality at play here.
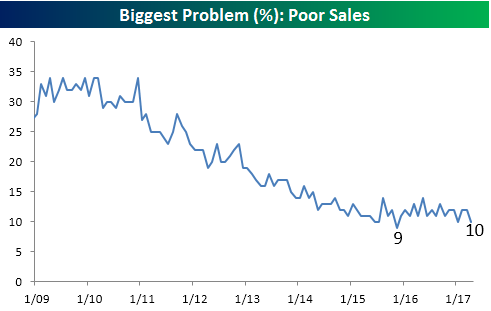
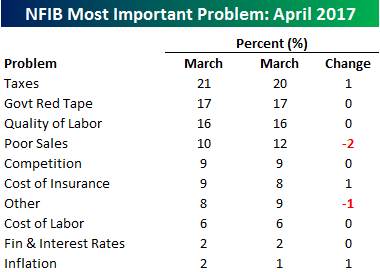 The chart to the right shows the issues that small businesses currently consider to be their number one problem. In this month’s report, there really wasn’t much in the way of movement here as Taxes and Red Tape still top the list of biggest problems and Quality of Labor (16%) rounds out the top three. The only real mover of note was the category of Poor Sales which dropped two percentage points to 10%. At current levels, that’s not far from its cycle low of 9% that we saw back in November 2015.
Start a 14-day free trial to our Bespoke Institutional research platform for more in-depth analysis of the market and economy.
The Closer — Unprecedented Lows For VIX Not An Argument To Own Vol — 5/8/17
Log-in here if you’re a member with access to the Closer.
Looking for deeper insight on global markets and economics? In tonight’s Closer sent to Bespoke Institutional clients, we take a look at the VIX, which closed today at the lowest level since December of 1993. We also review the Fed’s Labor Market Conditions Index and Canadian housing starts data updated today.

The Closer is one of our most popular reports, and you can sign up for a free trial below to see it!
The Closer is one of our most popular reports, and you can see it and everything else Bespoke publishes by starting a no-obligation 14-day free trial to our research!
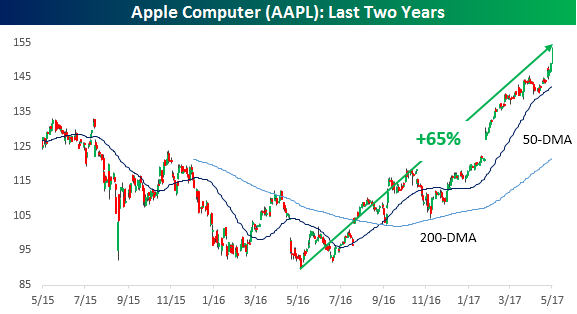
Apple Jacked
With shares of Apple (AAPL) up sharply yesterday, the company’s market cap crossed the $800 billion mark for the first time ever. The company is now just 25% away (barring any shrinkage from buybacks) from crossing the trillion dollar level. We say “just 25%” because from when it was trading in the low $90 range a year ago, shares of AAPL are up 65%. Looking at the chart from the last two years, it sure does look like the chart is starting to go parabolic. Back in late January when AAPL reported Q4 earnings, it already looked extended. Then in late February, it rose even more after Warren Buffett gave it his seal of approval. Now it just keeps rallying!
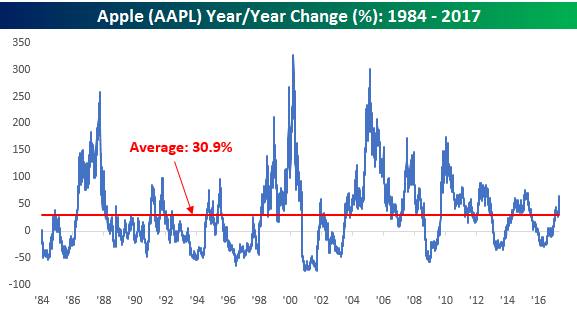
After a rally of over 65% in a year, it sure is easy to say that AAPL is more than overdue to pullback. When you look back at the stock on a historical basis, 65% y/y rallies are hardly out of the norm. The most recent such run ended two years ago in the spring of 2015. What’s even more incredible is that throughout its life as a public company, AAPL’a average y/y gain has been 31%. Over that same time, that’s 40% better than the 22% average y/y change that Berkshire Hathaway has experienced. While it is true that AAPL now is a larger company than it has ever been, it is not as though the company wasn’t one of, if not, the largest companies in the US when it had many of its most recent 65% y/y gains as well.
ETF Trends: US Indices & Styles – 5/8/17
Despite uninsipring performances in the immediate wake of the French election with declines in EURUSD and local currency indices around Europe, equity ETFs from that region are the strongest trailing 5 day performers we track in our ETF universe. On the losing side of the equation the hits keep coming for precious metals, oil, telecoms, and steel producers.
Bespoke provides Bespoke Premium and Bespoke Institutional members with a daily ETF Trends report that highlights proprietary trend and timing scores for more than 200 widely followed ETFs across all asset classes. If you’re an ETF investor, this daily report is perfect. Sign up below to access today’s ETF Trends report.
See Bespoke’s full daily ETF Trends report by starting a no-obligation free trial to our premium research. Click here to sign up with just your name and email address.