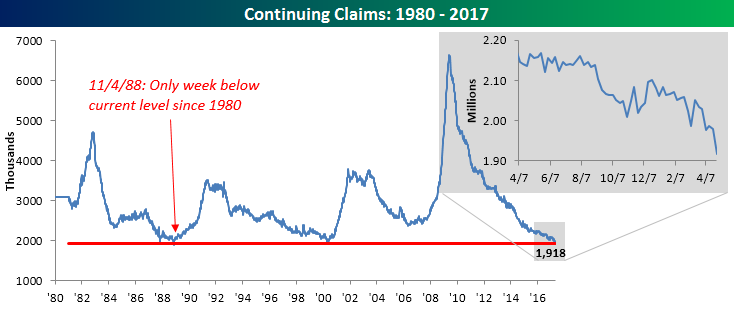
Continuing Claims Make Another Multi Year Milestone
In addition to this week’s lower than expected print in jobless claims, continuing claims were even more impressive. In this week’s report, continuing claims came in at 1.918 million, which was not only well below the consensus expectation of 1.980 million, but it was also the lowest weekly reading in this indicator of the current economic expansion. In fact, the only other time since 1973 where continuing claims were lower was in the first week of November 1988. Someday, both initial and continuing claims will start trending higher again, but until they do, it is a bullish sign for the market and economy.
For full access to our market analysis that is second to none, start a 14-day free trial to our Bespoke Institutional research platform.
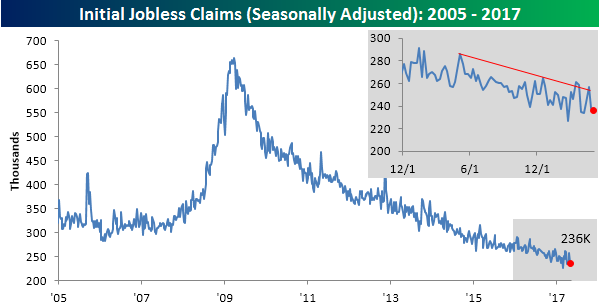
Jobless Claims Lower Than Expected
Jobless claims came in lower than expected this week, falling from 238K down to 236K and 9K below the consensus expectation for an increase to 245K. Once again, after bouncing higher two weeks ago, jobless claims are moving back down to the lower end of their range and are within 10K of the multi-decade low of 227K. This week’s print also marked the 114th straight week where claims have been below 300K.
For full access to our market analysis that is second to none, start a 14-day free trial to our Bespoke Institutional research platform.
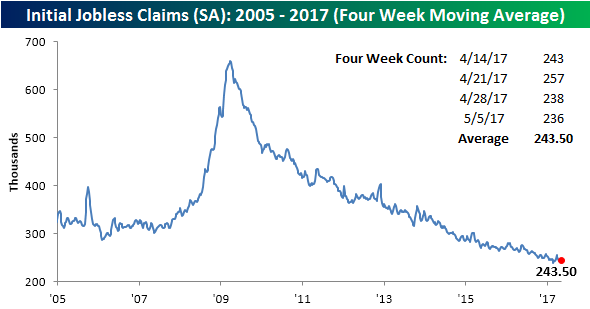
Looking at the four-week moving average, jobless claims ticked up slightly, rising from 243K up to 243.5K. Despite the slight increase, the four-week moving average is still within 4K of its multi-decade low.
On a non-seasonally adjusted basis, claims ticked up slightly rising from 211.3K up to 215K. For the current week of the year, that’s the lowest reading since 1973 and more than 115K below the average for the current week of the year dating back to 2000. No matter what metric you use, jobless claims were positive this week.
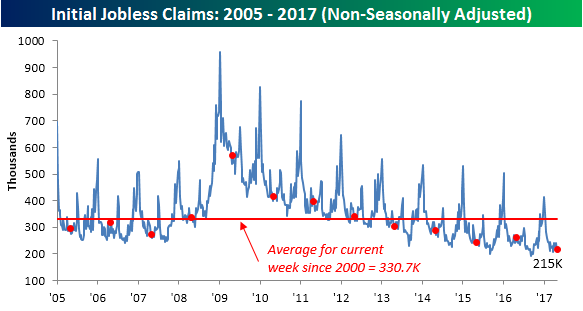
Chart of the Day: Credit Markets Confirming Rally
Bespoke Short Interest Report: 5/10/17
S&P 1500 Most Heavily Shorted Stocks
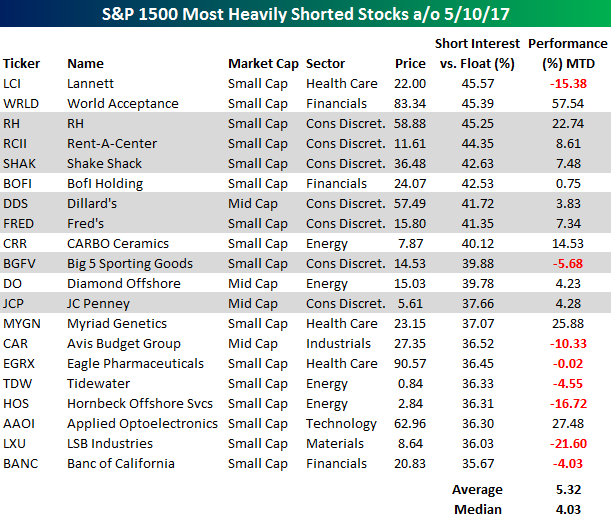
The major exchanges released short interest figures for the end of April after the close on Tuesday, and while overall levels of short interest didn’t see much in the way of major changes, the number of heavily shorted stocks continues to expand as 61 stocks in the S&P 1500 now have more than a quarter of their float sold short. In the interest of space, the table below lists the 20 stocks in the S&P 1500 with the highest levels of short interest as a percentage of float. As shown in the table, these stocks have been performing admirably so far in May with an average gain of 5.32% and a median gain of 4.03%. The big winner on the list has been World Acceptance (WRLD) which has rallied over 57%, helped in large part by a positive earnings report on Tuesday.
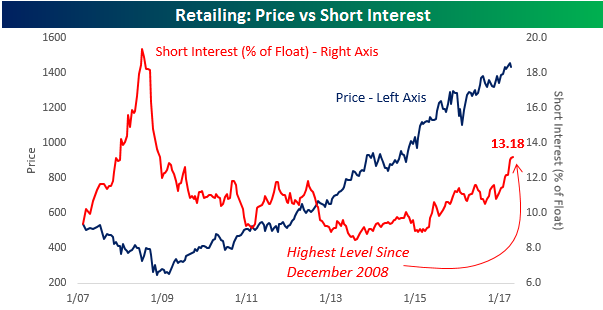 Another trend in the semi-monthly short interest figures over the last few months has been the strong presence of retail-related stocks. As shown in the chart, short interest as a percentage of float for the group is currently over 13% and at its highest level since the Financial Crisis. Obviously, with Death By Amazon, sentiment towards the retail sector is tilted to the negative side, and while our longer term view towards brick and mortar retail is negative, nothing moves in a straight line. There will be times when sentiment gets too extreme and the sector will rally.
One example of this shows up in the most recent short interest data. As shown, seven of the twenty stocks highlighted are retailers, ranging from RH with over 45% of its float sold short to JC Penney (JCP) which has close to 38% of its float sold short. In terms of performance, though, six of the seven stocks highlighted are up so far in May with an average gain of 7%. With some of these companies starting to report results that weren’t quite as bad as the market expected, the group is catching a break.
For full access to our market analysis that is second to none, start a 14-day free trial to our Bespoke Institutional research platform.
Larger Than Expected Declines in Crude and Gasoline Stockpiles
For full access to our market analysis that is second to none, start a 14-day free trial to our Bespoke Institutional research platform.
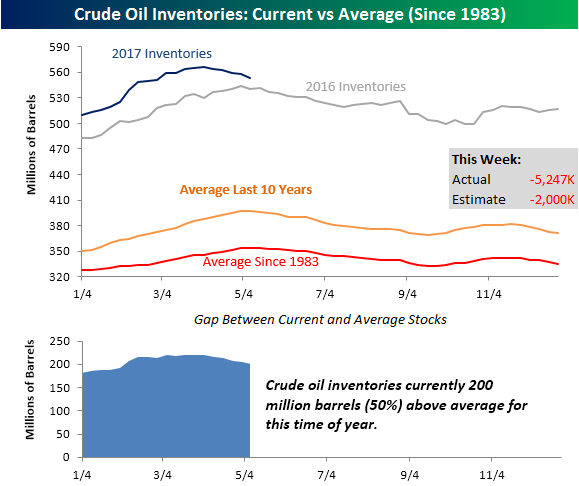
Today’s weekly inventory reports from the Department of Energy (DoE) showed larger than expected declines in both crude oil and gasoline stockpiles. Since it’s been awhile since we last updated our charts of current inventories relative to expectations, we wanted to update them below. In the case of crude oil, stockpiles declined by 5.247 million barrels versus expectations for a decline of just 2 million barrels. This week’s decline was also the largest weekly decline of the year. Looking at how inventories stack up relative to historical averages, current levels are still well above average and even above where they were at this time last year. What is important to note, though, is that inventory levels peaked at the end of March when they normally don’t peak until right about now. If the seasonal decline in stockpiles that normally begins in early May started a month early this year, that could help to support prices going forward.
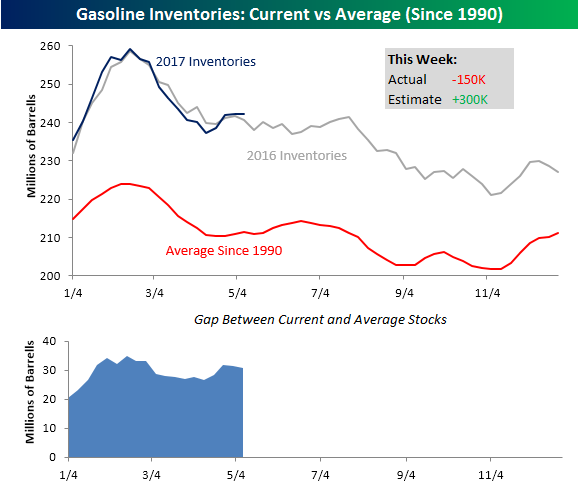
In terms of gasoline stockpiles, this week’s report showed a modest drawdown of 150K barrels compared to expectations for an increase of 300K. As shown in the chart, current inventory levels are pretty much right in line with where they were a year ago at this time and have been following the pattern of last year pretty closely. Relative to the long-term average going back to 1990, this year’s pattern has also been following the seasonal script, albeit from a much higher base.
The Closer — To EEM Or Not To EEM — 5/9/17
Log-in here if you’re a member with access to the Closer.
Looking for deeper insight on global markets and economics? In tonight’s Closer sent to Bespoke Institutional clients, we review the outlook for EM equities in the form of the MSCI EM ETF, EEM.

The Closer is one of our most popular reports, and you can sign up for a free trial below to see it!
The Closer is one of our most popular reports, and you can see it and everything else Bespoke publishes by starting a no-obligation 14-day free trial to our research!
Bespokecast — Episode 11 — Pete Najarian
 In our newest conversation on Bespokecast, we spoke to Pete Najarian, Co-Founder of Investitute. Pete is a long-time contributor on CNBC’s Fast Money and Fast Money Halftime Report, and a financial markets veteran with experience across the options world including the CBOE’s pits where he got his start. Prior to entering the financial industry, Pete played for the Minnesota Golden Gophers in the NCAA and the Tampa Bay Buccaneers and Minnesota Vikings in the NFL. We loved talking to him about his experience playing football, how athletics helped him in the industry, and what he thinks about the future of the game. Our conversation also touched on the skills necessary to have success trading options, some detail on strategies he uses to stay ahead of the market, and the impact of volatility products like VIX-linked ETFs or ETNs on the market for single name equity options. If you’re interested in options, be sure to visit Pete and his brother John’s site — Investitute — where they run their “Unusual Options Activity” service. We learned a lot chatting with Pete, and we hope you enjoy listening!
To access Episode 11 immediately, please start a 14-day free trial to Bespoke’s research product. If you’ve already signed up for a Bespoke free trial in the past, you can gain access by choosing a membership option at our products page. Here’s a look at past guests if you’re interested.

Still Waiting For Confirmation From the Cumulative A/D Line
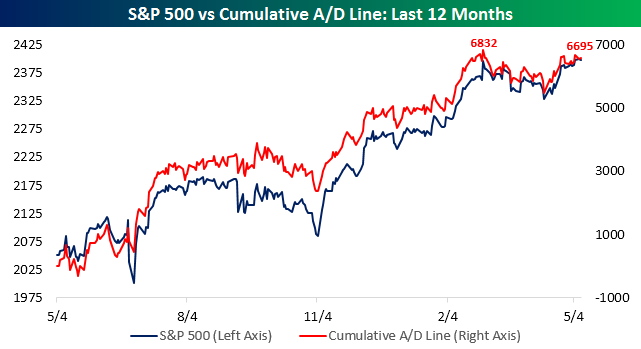
Whenever the S&P 500 makes a new high or low, we like to look at internal market indicators for signs of confirmation or divergence. One such indicator we track is the S&P 500 Cumulative A/D line. For those unfamiliar with the cumulative A/D line, simply put is a rolling total of the daily net number of stocks rising on a given day. To calculate it, each day we subtract the number of stocks that trade up on the day minus the number that trade down and then take that number and add it to the total from the prior day. With the S&P 500 making to marginal all-time closing highs in the prior two trading days, we wanted to update where this indicator currently stands.
The chart below shows the cumulative A/D line of the S&P 500 over the last year overlaid on a chart of the S&P 500’s price. Looking at how the two have moved over the last year, breadth has tended to track price pretty closely. Both price and breadth both made new bull market highs and then consolidated over the next two months. Then, last Friday, the S&P 500 finally took out that prior, albeit marginally. The cumulative A/D line, however, has yet to take out its prior high and remains 245 below its prior high. Granted, the S&P 500 only took out its prior highs by 0.14%, but as of yet, there has still been no confirmation of the new high. While not something to be concerned about at this point, if the S&P 500 rallies up above 2,420 and we still don’t see breadth confirm the high, it would become more of a concern. We’ll be watching!
For full access to our market analysis that is second to none, start a 14-day free trial to our Bespoke Institutional research platform right now.