Chart of the Day: Housing Provides a Sigh of Relief
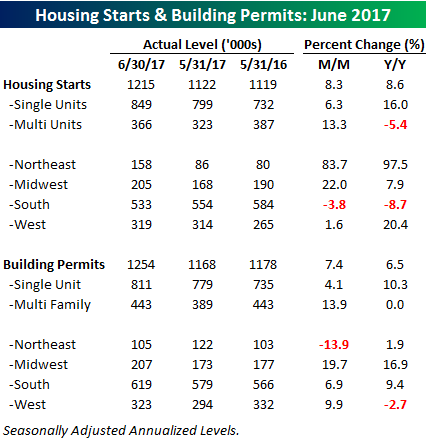
Four-Month Highs For Housing Starts and Building Permits
The US residential housing sector received a nice boost this morning as both Housing Starts and Building Permits for the month of June came in better than expected. That’s the first time both reports have exceeded estimates in the same month since the January report earlier this year. For each report, the actual reported number was more than 50K ahead of expectations and both readings were a four-month high. So, after a few months of declines, June’s numbers provided a nice respite from the lackadaisical numbers.
Start a two-week free trial to Bespoke’s research platform to see our full offering.
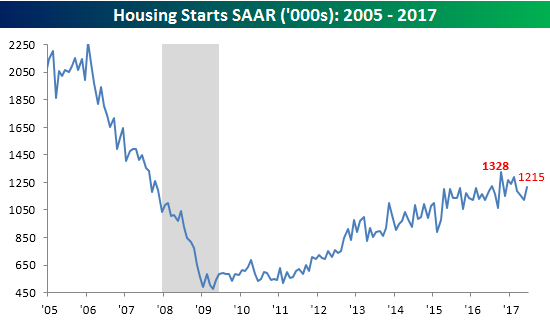
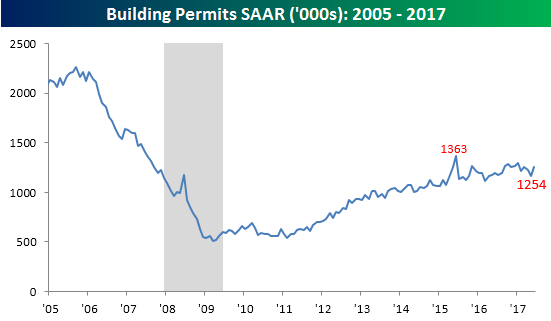
Taking a look at the internals of the report showed solid results. For Housing Starts, the 8.3% m/m gain was driven by a 13.3% gain in multi-family units and a 6.3% gain in single-family starts. For Building Permits, it was a similar picture as single-family permits increased 4.1%, while multi-family permits were up 13.9%. It would have been preferable to see more of the gains coming from single-family units, but with both showing growth, we’ll take it. On a regional basis, starts were strongest in the Northeast and Midwest, while permits showed the strongest m/m growth in the Midwest and West regions.
Homebuilder Optimism Up in Smoke
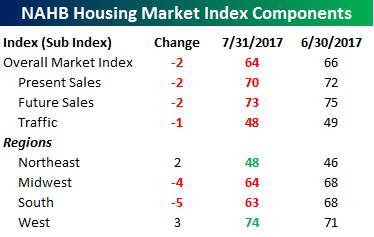
If there’s an economic indicator that gets released these days, taking the under usually ends up being the prudent bet. Today’s release of homebuilder sentiment for the month of July from the NAHB on Tuesday was the latest example. While economists were expecting the headline reading to come in at a level of 67, the actual reading was 64- the weakest reading since November. After a four-month surge post-election, the last four months have seen homebuilder sentiment decline in three of the last four months. Making matters worse, Tuesday’s reading was the weakest relative to expectations since May 2015.
Start a two-week free trial to Bespoke’s research platform to see our full offering.

The table below breaks down July’s report by Present and Future Sales, Traffic, and Regions. There wasn’t much to get excited about in July as every category of the report declined. On a regional basis, sentiment was more mixed with relatively large declines in the Midwest and South but actually increases in both the Northeast and West. Finally, Tuesday’s NAHB sentiment reading comes ahead of Wednesday’s report on Housing Starts, which has been weaker than expected for three straight months and Building Permits, which has missed the mark each of the last two months.
The Closer — Chinese Real Estate, European Banking, Obscure FX — 7/18/17
Log-in here if you’re a member with access to the Closer.
Looking for deeper insight on global markets and economics? In tonight’s Closer sent to Bespoke Institutional clients, we review monthly data from China on property prices, quarterly Eurozone Bank Lending Survey data on the supply and demand of bank lending in Europe, and take a look at some interesting FX charts.

The Closer is one of our most popular reports, and you can sign up for a free trial below to see it!
The Closer is one of our most popular reports, and you can see it and everything else Bespoke publishes by starting a no-obligation 14-day free trial to our research!
Bespoke Stock Scores: 7/18/17
Chart of the Day: IPOs Unimpressive
FANG Just Eats Up Washington Gridlock
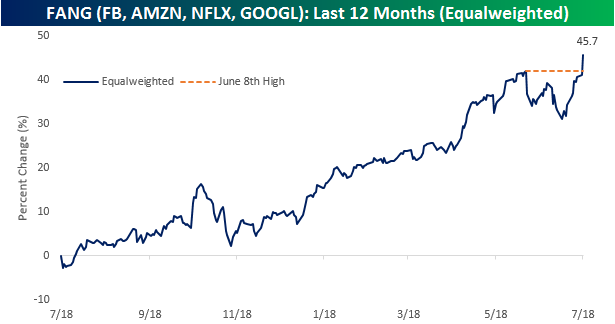
In the spirit of Mark Twain, the FANG stocks have roared back to life, definitively stating to the market that the reports of their demise have been greatly exaggerated. On an equal-weighted basis (chart below), an index of the four FANG stocks (Facebook, Amazon.com, Netflix, and Google-parent Alphabet) has now completely erased its 8% pullback from its 6/8 high and is now back at new highs. Over the last year alone, these four stocks are up an average of 45.7%. Whenever there is optimism that the Trump Administration will get something passed, high growth tech stocks start to lose momentum, but once it looks like more of the same old Washington gridlock, high growth stocks like FANG really run.
Start a two-week free trial to Bespoke’s research platform to see our full offering.
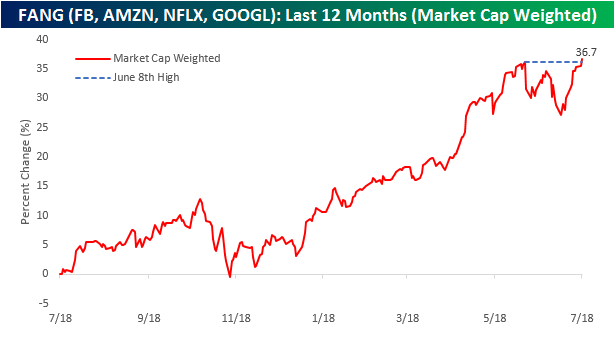
A lot of today’s strength in the performance of the FANG stocks on an equal-weighted basis is the fact that shares of Netflix (NFLX) are up over 12% following its strong earnings report after the close last night. NFLX has a much smaller market cap than the three other stocks that make up the FANG group, but even on a market cap weighted basis, the four FANG stocks are still at new highs. As shown below, a market cap weighted index of the four stocks has also more than erased what in this case was a 7% pullback and is also trading at new highs today. So much for the death of FANG.
ETF Trends: US Sectors & Groups – 7/18/17
South Africa tops this week’s list of best performers among the ETFs that we track, up over 7% after seeing almost a 3% decrease last week. Oil made a similar turnaround, up just over 4% this week after topping our list of worst performers last week when it was down 7%. Coffee, Solar, and a handful of European countries are also notable outperformers. Mortgage Real Estate headlines the struggling ETFs, along with the US Dollar and Banks. Home Construction followed up its strong performance last week with a nearly 0.5% setback this week.

Bespoke provides Bespoke Premium and Bespoke Institutional members with a daily ETF Trends report that highlights proprietary trend and timing scores for more than 200 widely followed ETFs across all asset classes. If you’re an ETF investor, this daily report is perfect. Sign up below to access today’s ETF Trends report.
See Bespoke’s full daily ETF Trends report by starting a no-obligation free trial to our premium research. Click here to sign up with just your name and email address.
The Closer — Capital Expenditure, Venture Capital, and Canadian Housing — 7/17/17
Log-in here if you’re a member with access to the Closer.
Looking for deeper insight on global markets and economics? In tonight’s Closer sent to Bespoke Institutional clients, we take a look at the outlook for US capex, along with slowing venture capital funding flows and what looks to have been a peak in Canadian home price appreciation.
The Closer is one of our most popular reports, and you can sign up for a free trial below to see it!
The Closer is one of our most popular reports, and you can see it and everything else Bespoke publishes by starting a no-obligation 14-day free trial to our research!
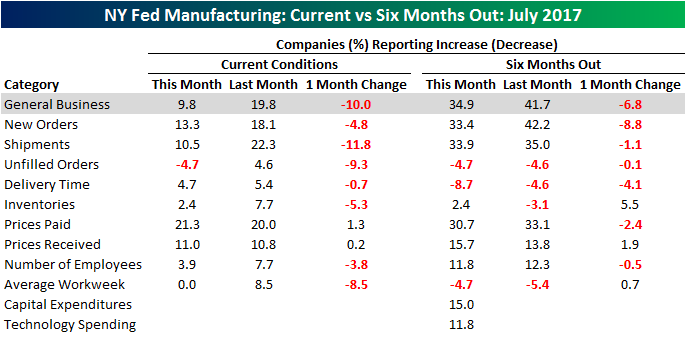
Empire Manufacturing Picking Up Right Where Last Week Left Off
After a pretty lousy week relative to expectations for US economic data last week, this week started off with more of the same as the Empire Manufacturing report for July came in below expectations. While economists were looking for the headline index to come in at 15.0, the actual reading came in a bit weaker at 9.8. Similarly, expectations for conditions six months from now also declined from 41.7 down to 34.9, which is the lowest level since right before the election. In terms of plans for Cap Ex and Technology spending, Cap Ex saw a modest decline, while plans for Tech spending were stable.
Start a two-week free trial to Bespoke’s research platform to see our full offering.
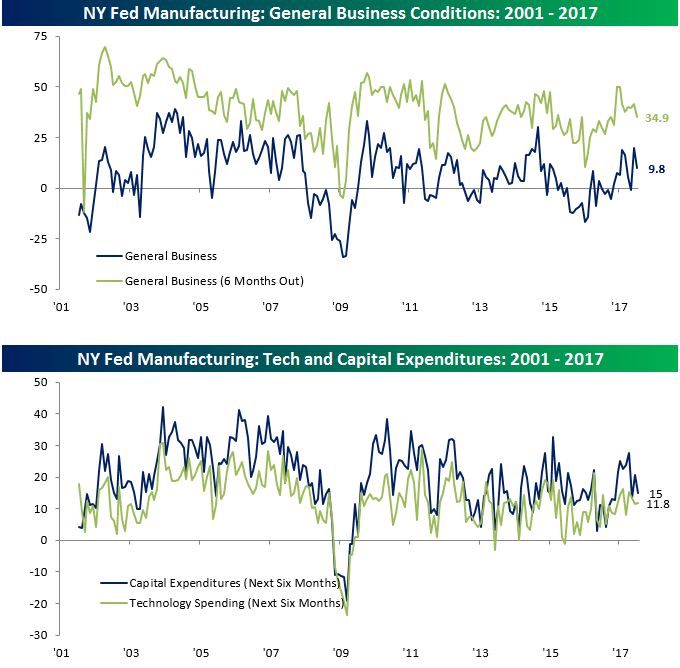
As far as the internals of the July report were concerned, breadth was very weak. Of the nine components in the report, just two (Prices Paid and Prices Received) saw a m/m increase, while Shipments and Unfilled Orders saw the largest declines. For conditions six months from now, we saw a similar trend in breadth with seven m/m declines and just two increases.