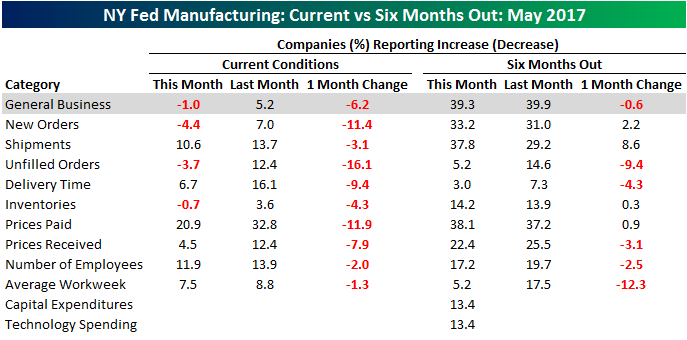
Empire Manufacturing Shrinks Back to Pre Election Levels
It was a nice run while it lasted. Following a surge in optimism on the part of New York Manufacturers in the wake of November’s election, sentiment in the region has now given up all of the post-election gains and moved back into negative territory. In this month’s Empire Manufacturing survey, the index of current general business conditions dropped for the third straight month. While economists were expecting the headline index to come in at a level of +7.5, the actual reading came in at -1, which was the lowest level since last October. While General Business conditions declined, manufacturers are still optimistic as expectations were pretty much unchanged at 39.3.

What was really disheartening about this month’s report was that there were really no bright spots. The table below breaks down this month’s report by each of the survey’s sub-indices. As shown on the left side of the table, in terms of current conditions, every category declined month/month. To find the last time that happened, you have to go back exactly four years to May 2013. Expectations didn’t fare much better as just four categories showed an uptick while five declined. This is certainly not the type of economic data you want to see to kick off the week.
If you’re not yet a Bespoke Premium member, start a 14-day free trial to gain access to our full research offering, including our full range of economic analysis.
Crude Oil: Killing Three Birds With One Stone
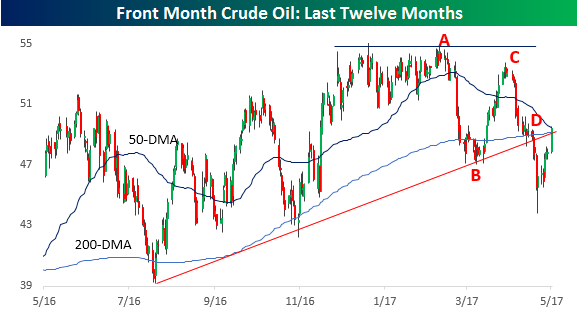
Following an agreement between OPEC and Russia to extend oil production cuts out to March 2018, crude oil prices are trading at their highest levels in two weeks and also back near $50 per barrel. From a technical perspective, though, today’s price action is much more noteworthy. After failing to break out above resistance in late February (point A in chart), crude oil prices fell sharply, bounced at trendline support (point B), then made a lower high (point C). Following that lower high, oil sold off again, but this time that trendline offered little in the way of support (point D). Normally, when that type of support breaks, it turns into resistance going forward, but as crude oil prices have rallied overnight, the commodity is poised to move not only back above that trendline, but also back above its 50 and 200-day moving averages all in one shot. If it holds, that would be killing three birds with one stone!
If you’re not yet a Bespoke Premium member, start a 14-day free trial to gain full access to Bespoke’s research offering.
Bespoke Brunch Reads: 5/14/17
Welcome to Bespoke Brunch Reads — a linkfest of the favorite things we read over the past week. The links are mostly market related, but there are some other interesting subjects covered as well. We hope you enjoy the food for thought as a supplement to the research we provide you during the week.
Fiscal Matters
Trump’s Biggest Hurdle on Tax Cuts? Congress’s Daunting Calendar by Sahil Kapur (Bloomberg)
Large-scale tax reform (or any tax reform for that matter) is threatened by the cluttered schedule facing Congress, especially the Senate. [Link; auto-playing video]
Macron calls for radical reform to save euro by Ferdinando Giugliano and Sarah Gordon (FT)
Not a new story (dated to 2015) but an illuminating one on how the new President of France views the prospects for European fiscal integration. [Link; paywall]
New Tech
Apple Will Announce Amazon Prime Video Coming To Apple TV At WWDC by John Paczkowski (BuzzFeed)
Banned since 2015, Amazon’s video streaming platform for Prime customers will once against be available for Apple TV users. [Link]
Tesla’s Solar Roof Sets Musk’s Grand Unification Into Motion by Tom Randall (Bloomberg)
Elon Musk’s Tesla is taking deposits for roof tiles that operate as solar panels, moving closer to a full suite of transportation and home products that are entirely off the grid. [Link; auto-playing video]
Bonkers
There Are Now More Indexes Than Stocks (Bloomberg)
Remarkably, there are more indices of US stocks than there are US stocks, with more than 5,000 different indices flooding the market. [Link]
Inside VW’s Campaign of Trickery by Jack Ewing (NYT)
Astounding details on how deep and pervasive the effort to deceive US emissions tests was at Volkswagen, with the key decisions dating back as early as 2006. [Link; soft paywall]
Banking
Watch out Wall Streeters: Your jobs are moving to North Carolina (Reuters/Business Insider)
Swiss investment bank Credit Suisse has announced it will move 1200 jobs to the land of the Tar Heel, supported in part by grants from the NC government. [Link]
JPMorgan Tells Banks to Partner Up as U.S. Deposit Drain Looms by Matthew Monks (Bloomberg)
With the Fed considering an end to reinvestment of the QE bond portfolio, excess reserves are expected to fall and with them deposits. [Link]
Diet
Why Everything We Know About Salt May Be Wrong by Gina Kolata (NYT)
Studies done on Russian cosmonauts indicate that consuming higher volumes of salt actually leads to weight loss rather than weight gain. [Link; soft paywall]
49th Parallel
We Could Have Been Canada by Adam Gopnik (New Yorker)
What if the American Revolution hadn’t happened? Could we have ended slavery sooner, avoided the Civil War, and ended up more like Australia or Canada? [Link]
Correcting Frameworks
The Robots Have Taken Over (Our Brains) by Matt Busigin (New River Investments)
The current obsession over job-stealing robots isn’t grounded in economic data and completely fails to see the forest for the trees. [Link]
Web Design: First 100 Years by Maciej Cegłowski (Idle Words)
A brilliant talk that illustrates the importance of diminishing marginal returns and functional design while giving an excellent blueprint for the future. [Link]
Sports
A Home Playoff Game Is A Big Advantage — Unless You Play Hockey by Neil Paine (538)
Astoundingly, home playoff hockey teams win at a lower percentage than regular season home teams. [Link]
Have a great Sunday!
The Closer 5/12/17 – End of Week Charts
Looking for deeper insight on global markets and economics? In tonight’s Closer sent to Bespoke clients, we recap weekly price action in major asset classes, update economic surprise index data for major economies, chart the weekly Commitment of Traders report from the CFTC, and provide our normal nightly update on ETF performance, volume and price movers, and the Bespoke Market Timing Model. This week, we’ve added a section that helps break down momentum in developed market foreign exchange crosses.

The Closer is one of our most popular reports, and you can sign up for a free trial below to see it!
Click here to start your no-obligation two-week free Bespoke research trial now!
The Bespoke Report Weekly Newsletter — 5/12/17
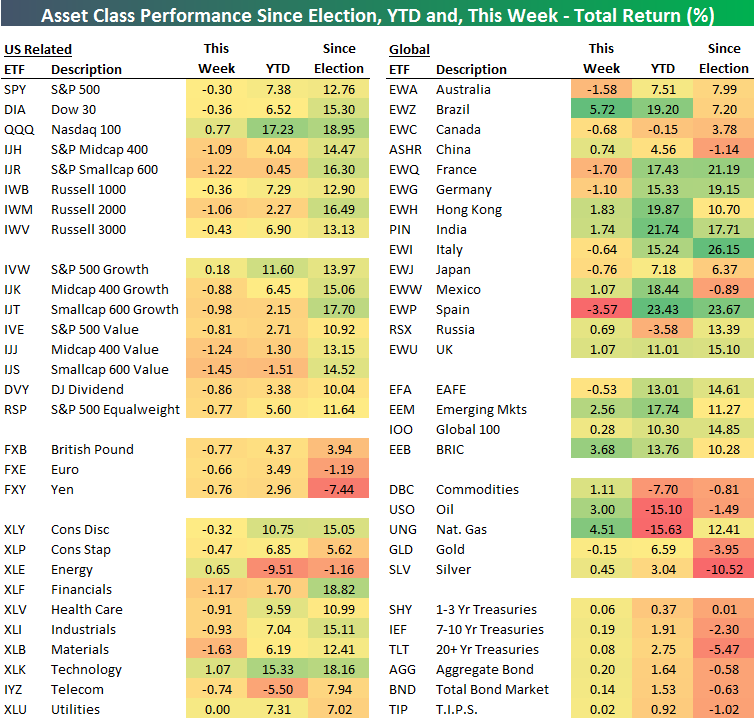
Bespoke’s Asset Class Performance Matrix
Monday, May 8th marked the six-month point since Trump was elected on 11/8/16. Below is a look at our asset class performance matrix, which highlights the total return of a wide variety of ETFs. The three time frames used in this edition of the matrix are since the election (11/8/16), year-to-date, and this week.
As shown, equities in the US faded a bit this week, but they’re still up massively since the election. Performance for foreign markets was scattered this week, with Brazil surging 5.7% and Spain falling 3.6%. Commodities had a bounce back week, but they’re still down since the election with the exception of UNG. Treasury ETFs saw a slight week-over-week bounce, and they’re now solidly in the green on the year even though they’re still down since the election.
If you’re not yet a Bespoke Premium member, start a 14-day free trial to gain access to our full research offering, including our weekly Bespoke Report newsletter.
S&P 500 Quick View Chart Book: 5/12/17
Each weekend as part of our Bespoke Premium and Institutional research service, clients receive our S&P 500 Quick-View Chart Book, which includes one-year price charts of every stock in the S&P 500. You can literally scan through this report in a matter of minutes or hours, but either way, you will come out ahead knowing which stocks, or groups of stocks, are leading and lagging the market. The report is a great resource for both traders and investors alike. Below, we show the front page of this week’s report which contains price charts of the major averages and ten major sectors.
To see this week’s entire S&P 500 Chart Book, sign up for a 14-day free trial to our Bespoke Premium research service.

ETF Trends: International – 5/12/17
Gold and natural gas continue to outpeform, along with a number of Asian equities; we note that while onshore Chinese equities have undeperformed notably, MCHI, GXC, and FXI all hold Hong Kong-listed offshore equities which have outperformed. EM broadly continues to rally. Worst performers include banks, some European country ETFs (including, surprisingly, France), and a number of US sectors.

Bespoke provides Bespoke Premium and Bespoke Institutional members with a daily ETF Trends report that highlights proprietary trend and timing scores for more than 200 widely followed ETFs across all asset classes. If you’re an ETF investor, this daily report is perfect. Sign up below to access today’s ETF Trends report.
See Bespoke’s full daily ETF Trends report by starting a no-obligation free trial to our premium research. Click here to sign up with just your name and email address.
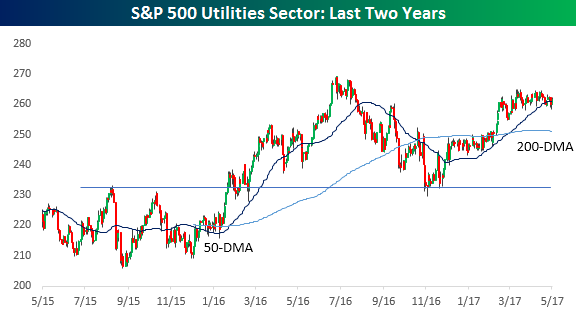
Utilities: Re-Charging For a Breakout?
We don’t talk about the Utilities sector a whole lot, but in putting together our S&P 500 Chart Book this week, there were a number of interesting looking charts in the sector. Given their heavily regulated nature, in many cases, charts of stocks in the Utilities sector often look indistinguishable from one another. Given that, right now we’ll just focus on the chart of the overall sector. After a big run-up in late 2015 through the first half of 2016 on the heels of falling interest rates, the sector fell on some hard times in the second half of 2016. The lows following that sell-off, though, came right after the election when interest rates spiked. You’ll also notice that the decline came to an end right at the previous highs before the late 2015 breakout, and since then it has rebounded nicely. Beginning in late February, however, the sector has been in a sideways range consolidating those gains right below its prior highs. With this sideways range forming a nice base for the sector, any rally from here should be enough to power it right past those prior highs.
If you’re not yet a Bespoke Premium member, start a 14-day free trial to gain access to our full research offering, including our weekly Bespoke Report newsletter.
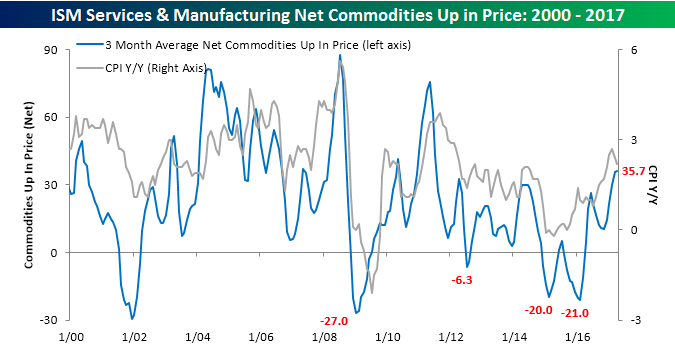
ISM Commodities Survey Diverges From CPI
Today’s CPI report for the month of April showed a smaller than expected increase resulting in a y/y increase in the headline reading of 2.2%. That’s down 0.2 percentage points from last month and down a full half point from the multi-year high of 2.7% that we saw in February. Whenever we look at overall inflation levels, one secondary indicator we like to look at for confirmation of the overall trend is the monthly commodity surveys in the ISM Manufacturing and Non-Manufacturing reports. In a nutshell, these surveys ask respondents about which commodities they deal with are rising and falling in price, and usually, we have found that trends in these surveys tend to coincide or even lead the overall trend in headline inflation. This month, though, we have seen some mixed signals.
With regards to the Manufacturing sector, in this month’s survey respondents noted price increases in 20 commodities and no declines. While twenty is on the high side, it was the lowest monthly reading of the year. In the Services sector, we saw a similar trend. Overall, 16 commodities were up in price and four were down, leaving a net of 12. Adding up the results of both surveys, the net number of commodities rising in price in April was 32, which was down from March’s five-year high of 41.
The chart below compares the three-month moving average of the net number of commodities rising in price compared to the y/y change in CPI. At this month’s level of 36.0, the three-month moving average is at its highest level since July 2011 and has now ticked higher for the fifth straight month, which is the longest monthly streak of increases since July 2015. As shown on the rightmost side of the chart, even as CPI has started to decelerate, the trend in commodity prices has remained higher. This is a trend we wouldn’t expect to continue, and they should both start moving in the same direction. Based on some of the trends we see in the individual monthly data, we would expect to see the trends in the commodities survey start to follow inflation data lower.
If you’re not yet a Bespoke Premium member, start a 14-day free trial to gain access to our full research offering, including our weekly Bespoke Report newsletter.